
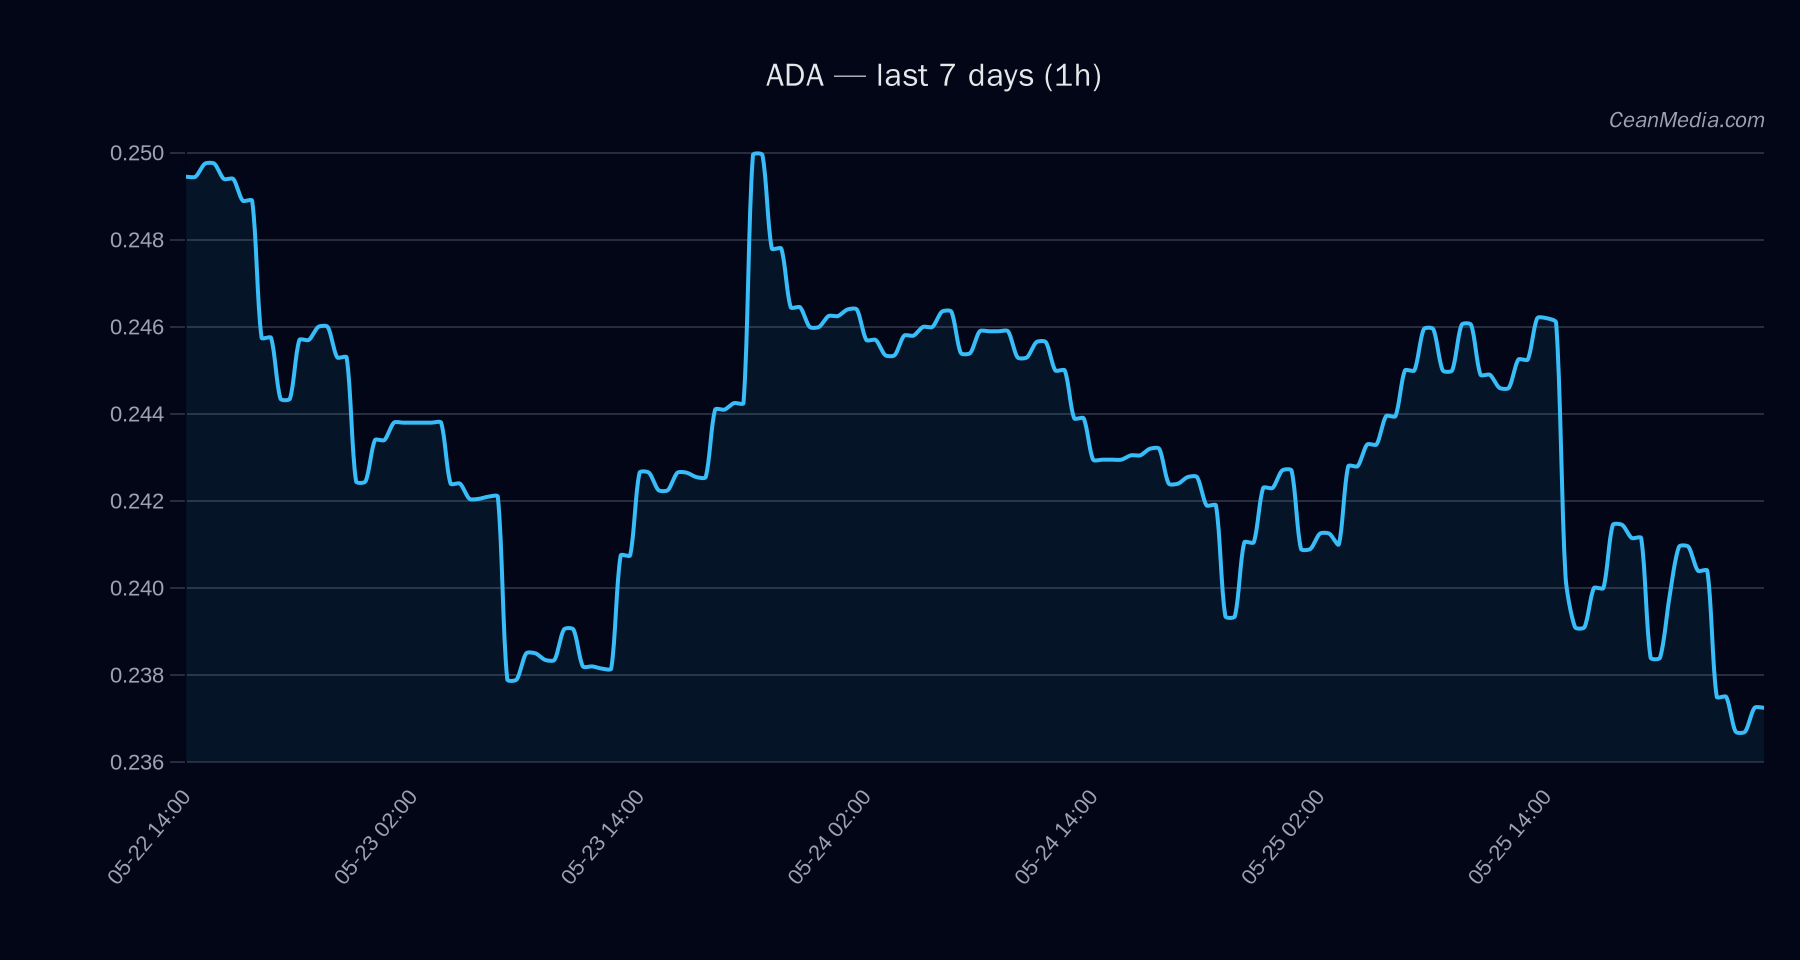
Market Snapshot
As of 2026-05-27, ADA is trading near a short-term support zone with a close around 0.2373. The composite view shows mixed-to-bearish pressure with low certainty (5/100) and a final bias leaning towards bearish pressure overall. Market context indicates very low volatility and limited breadth above the 50-hour average, with BTC’s dominance near 57.8% and extreme fear sentiment in broader markets.
Technical Analysis: ADA
- Current price: 0.2373
- Bias: mixed/bearish pressure; certainty low (5/100)
- Composite score: -2.8
- TA trend: bearish; RSI 37
- Key indicators: EMA12 < EMA26; SMA50 < SMA200; σ24h = 0.70%; Vol regime: Very low
- Forecast: Up (61%) with a probability mix of Up 61%, Sideways 14%, Down 25%
- Support: near 0.235
- Major support: 0.235
- Resistance: near 0.24
- Major resistance: 0.26
- Triggers:
- Up: 1h close > 0.24 → target 0.2468 / 0.2517
- Down: 1h close < 0.235 → target 0.2279 / 0.2232
Forecast range (P50): 0.2384; 20th-80th percentile: 0.2319–0.2422. The current read notes that information is not fully aligned, and traders should await trigger confirmation for higher conviction.
Drivers
- Top contributing factors:
- EMA slope: -0.0018
- Funding Z-score: -0.989
- Basis Z-score: 0.352
- OBI EMA5: -0.011
- Macro/Macrovolatility context:
- Cross-market risk assets soft
- Stablecoin liquidity contracting
- Sentiment: Extreme fear
- BTC dominance: ~57.8% (+/- recent delta)
- Vol regime: Very low
ETF Flows (BTC/ETH)
Contextual note: ETF flow data provided is limited to BTC and ETH and should not be treated as a primary signal for ADA pricing. The data can offer risk-on/off context for the broader market environment.
- BTC ETF: +$629.8M (1D), +$198.4M (5D), +$585.2M (10D)
- ETH ETF: +$101.2M (1D), -$20.8M (5D), +$81.6M (10D)
The ETF flow data suggest a current risk-on tilt for BTC and ETH over short horizons, which can influence sentiment and liquidity conditions in correlated assets, including ADA. However, ADA-specific moves will depend on its own technicals and flow dynamics rather than ETF signals alone.
What to Watch Next
- Monitor for a 1h close above 0.24 to validate the Upside trigger toward 0.2468–0.2517.
- Watch for a break below 0.235 to confirm downside targets toward 0.2279–0.2232.
- Observe changes in volatility regime and breadth, especially any broadening above SMA50, which could indicate evolving momentum.
- Assess shifts in BTC/ETH ETF flows as a contextual backdrop for market risk sentiment.
Hashtags: #ADA #CryptoAnalysis #TechnicalAnalysis #MarketSnapshot #ETFFlows #BTC #ETH #Altcoins #TradingStrategy #PriceAction #Volatility #MarketContext