
Market Snapshot
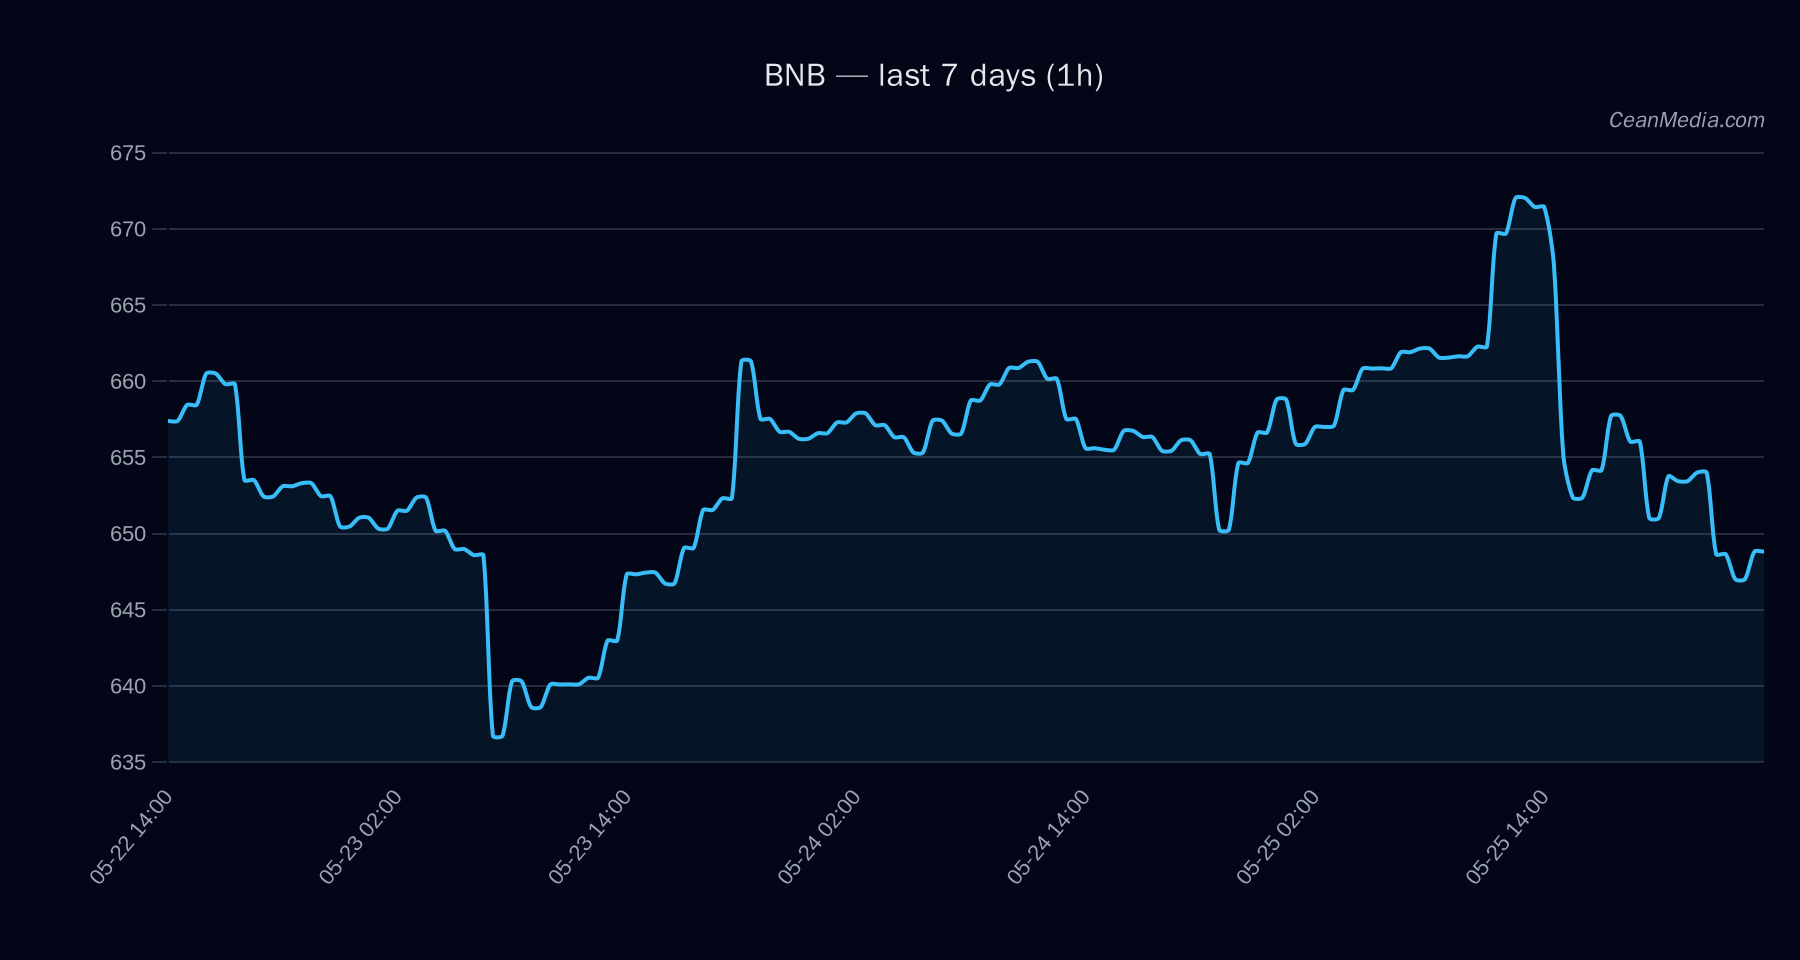
BNB paused in a tight range with price around 648.82 as of the latest close. The broader signals indicate a mixed to bearish bias with low conviction. Market breadth remains weak and cross-asset risk appetite shows softness in equities, while stablecoin liquidity slightly contracts. The immediate price action remains confined between key levels, with a potential for a downside drift if support fails to hold.
Technical Analysis: BNB
: -2.7; data completeness about 90% with snapshot age ~0.5h. : 648.82 : Sideways; RSI 39 : EMA12 < EMA26, SMA50 > SMA200, RSI 39, volatility (σ24h) 0.56%, very low vol regime - Upward trigger: 1h close > 662 → potential move to 675.03 / 688.27
- Downward trigger: 1h close < 636 → potential move to 623.13 / 610.41
Drivers
(relative impact on forecast): - EMA slope: -0.0012 (slightly negative backdrop)
- Funding Z-score: 0.71 (mild bullish funding pressure)
- BASIS Z-SCORE: 0.02
- Order-book imbalance (EMA5): -0.04
- BTC dominance: ~57.8% (high but slightly down 7d)
- BTC 7d rv: ~0.018
: Cross-market risk assets softer; stablecoin liquidity contracting; sentiment showing extreme fear (25). : Very low vol regime; breadth below 50% above SMA50; BTC/alt correlation remains elevated (~0.85 with BTC volatility context).
ETF Flows (BTC/ETH)
Note: ETF flow data presented here is for BTC and ETH only. This context is supplementary and should not be treated as a primary signal for BNB trading decisions. Recent data show:
- BTC ETF: +$629.8M (1D), +$198.4M (5D), +$585.2M (10D)
- ETH ETF: +$101.2M (1D), -$20.8M (5D), +$81.6M (10D)
Interpretation: The BTC ETF inflows indicate ongoing risk-on appetite for BTC-related exposure in the near term, suggesting a supportive backdrop for liquidity and risk sentiment. However, the absence of a direct link to BNB means this context should be weighed as a market-wide sentiment overlay rather than a precise driver for BNB price action. Despite ETF inflows, BNB’s own technical indicators point to continued consolidation with downside risk if key supports fail.
What to Watch Next
- Watch for a daily close above 662 to validate a short-term bullish trigger toward 675–688.
- Monitor for a break below 636 to confirm renewed downside momentum toward 623–610.
- Keep an eye on volatility regime shifts; any expansion could alter the validity of the current sideways setup.
- Stay aware of BTC/ETH ETF flow moves as a sentiment backdrop, but maintain focus on BNB-specific levels and signals.
Hashtags: #BNB #CryptoAnalysis #TechnicalAnalysis #MarketSnapshot #ETFFlows #BTC #ETH #RiskOn #CryptoTrading #Liquidity #Volatility