Market Snapshot
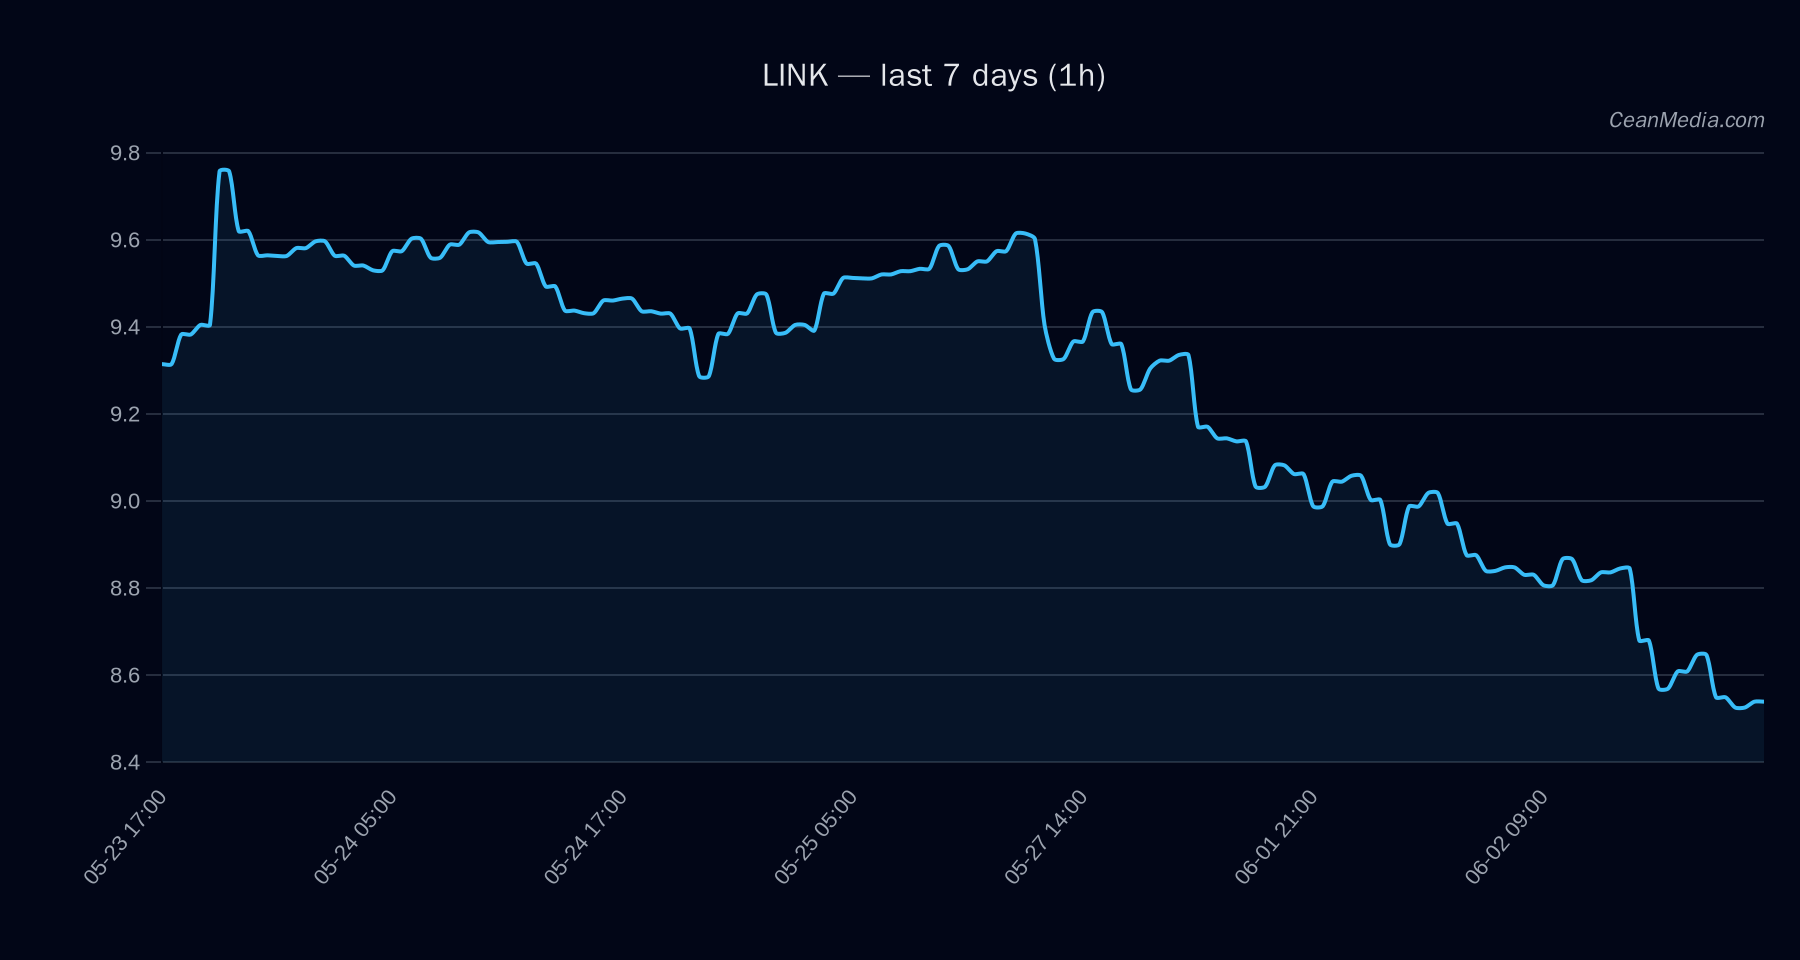
As of 2026-06-02, LINK is trading with a bearish tilt in the near term, set against a backdrop of very low volatility and a broad risk-off sentiment in cross-asset markets. The current price sits around 8.53, within a defined range bounded by major support near 8.36 and major resistance near 9.36.
Technical Analysis: LINK
- Bearish with high certainty (74/100).
- -5.2 (no conflicts).
- Close at 8.532.
- Bearish. Indicators: EMA12 < EMA26, SMA50 < SMA200, RSI 27, volatility (σ24h) 0.69%, very low vol regime. RSI is oversold, suggesting potential for a near-term relief bounce but remains within a bearish regime.
- Model indicates sideways action with a 9% probability, price range P20-P80 of 7.78–10.10, suggesting limited immediate directional conviction.
- Support near 8.36 (major 9.32 resistance at the upper band around 9.36). Trigger levels:
- Up: 1h close > 8.7 → potential move toward 8.88 then 9.05.
- Down: 1h close < 8.36 → potential move toward 8.19 then 8.03.
- Break above 8.7 would align with a more constructive path toward the 9.0–9.05 region; break below 8.36 would open downside tests to 8.19–8.03.
Drivers
- BTC Dominance Z-score (-2.98 contribution), Stable MCAP Z-score (-1.42), Liq to OI Z-score (1.40), Return 24H (-0.06), Spread Z-score (1.2), LS Top Z-score (-1.19).
- Very low vol regime; vol unit 0.0683, ATR 0.0475. Breadth shows limited participation (0% above SMA50). BTC correlation 0.73 over 72h.
- Extreme fear (F&G 23). Cross-market risk assets softening by ~1.25%.
- Longs appear crowded (1.36x) with liquidations skewed negatively in some scenarios. Taker flow is balanced at 15.3%.
ETF Flows (BTC/ETH)
Contextual signal: ETF flow data provided is limited to BTC and ETH and is not a primary signal for LINK. The data indicates constructive near-term appetite for BTC and ETH ETFs, which can influence risk-on/-off dynamics across crypto markets—but LINK-specific moves should be interpreted with the LINK technicals and market structure in mind.
- 1D +$629.8M; 5D +$198.4M; 10D +$585.2M.
- 1D +$101.2M; 5D -$20.8M; 10D +$81.6M.
The positive BTC/ETH ETF flow signal suggests a potential risk-on backdrop developing over the near term, which could support broader crypto risk assets. However, this should be treated as contextual input rather than a primary driver for LINK alone.
What to Watch Next
- Monitor 1h closes around 8.7 to assess potential upside continuation toward 8.88–9.05.
- Watch for a break below 8.36 to validate downside tests toward 8.19–8.03.
- Observe BTC/ETH ETF flow momentum for potential shifts in risk appetite that could impact LINK funding and asset correlation.
- Keep an eye on RSI and vol regime signals for any signs of a regime change from very low to higher volatility, which could alter the risk-reward dynamics.
Hashtags: #LINK #CryptoAnalysis #TechnicalAnalysis #MarketStructure #BTCETFFlow #ETHETFFlow #Volatility #RiskOn #OrderFlow #MarketMomentum #CryptoNews #PriceLevels