Market Snapshot
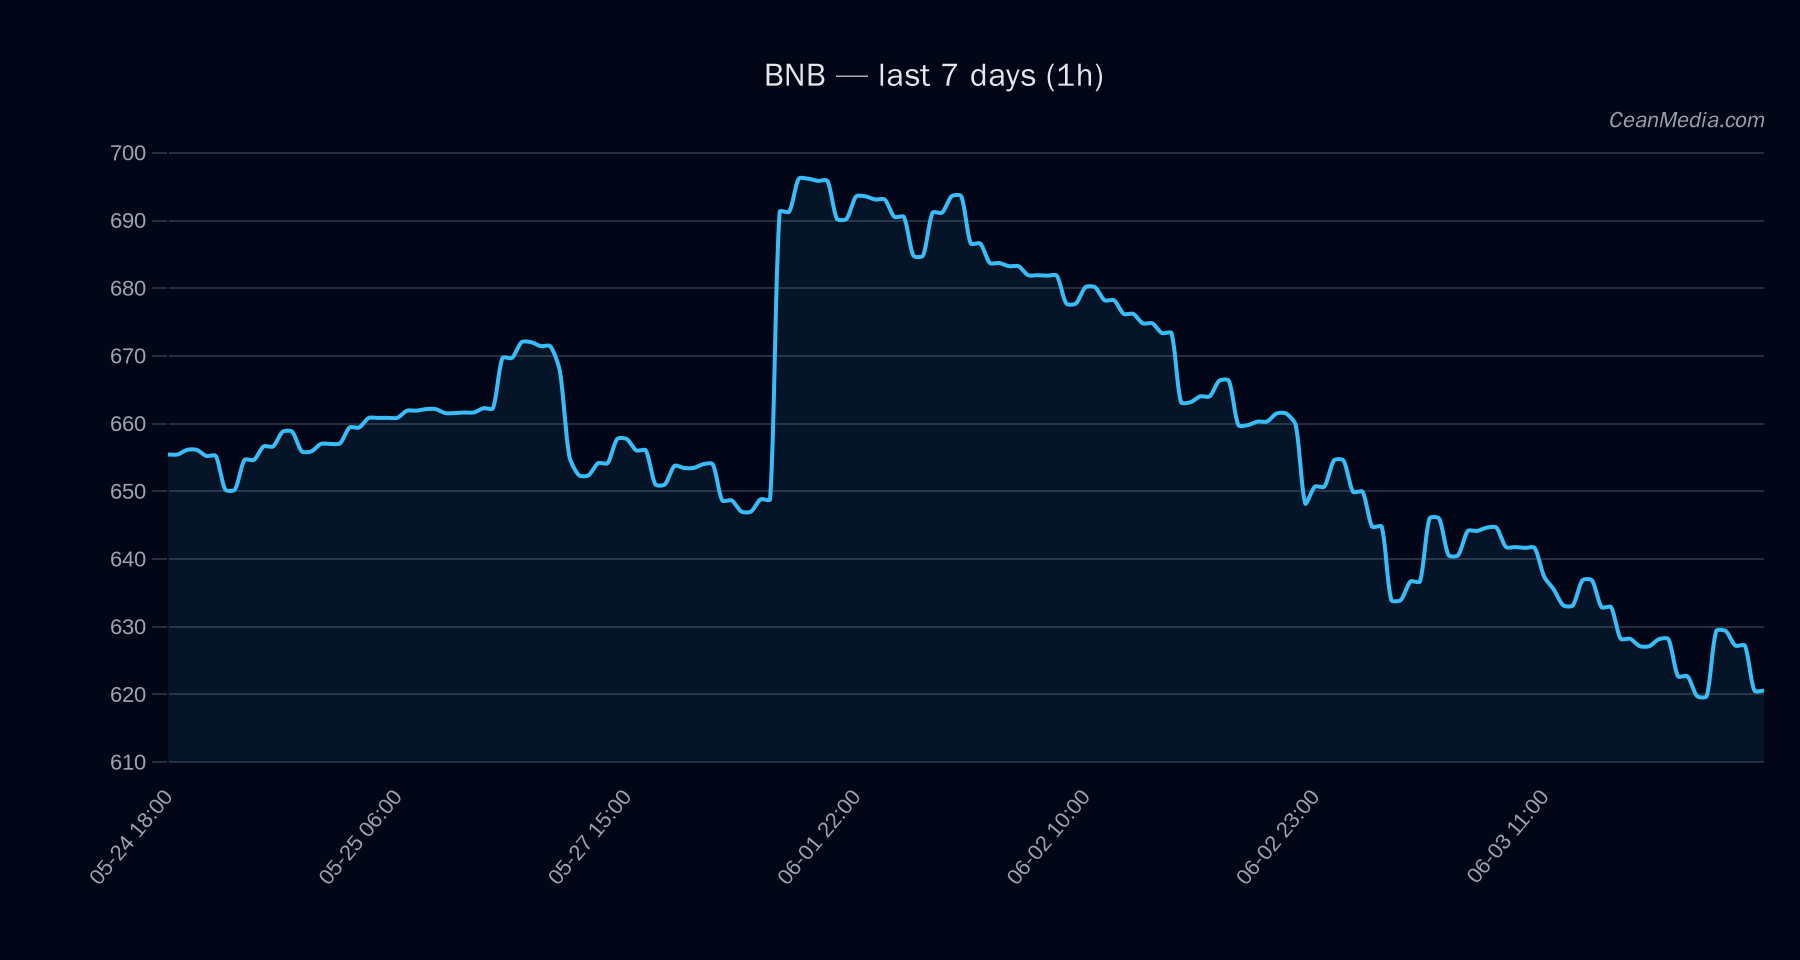
On 2026-06-04, BNB sits around the 600s with a near-term bias deteriorating toward the downside, as indicated by the latest composite signal. The price closed at 616.75 with a very low volatility regime and a neutral-to-bearish technical setup. ETF flow context is provided for BTC and ETH to help gauge broader risk sentiment, though it is not the primary driver for BNB projections.
Technical Analysis: BNB
Down 59% probability; Upside 31%; Sideways 10%. Sideways with RSI at 31, EMA12 Price near support at 604 and resistance at 629. Major level near 640 and a potential downside target around 592–580 in a break below 604. Break above 629 suggests a path to 641.67–654.25. P50 around 616.56; P20–P80 between 608.94 and 660.07. - Up: 1h close > 629 → target 641.67 / 654.25
- Down: 1h close < 604 → target 592.33 / 580.24
Support near 604; major support at 580–592 if downside persists. Resistance near 629; major resistance around 674.
Drivers
- Top model drivers include FNG Z-Score, BTC Dominance Trend (7D), and Depth USD 10bp log1p; each contributing to the bearish tilt.
- Distance from MA and BTC dominance also weigh on the outlook, with RV (relative volatility) and trend strength modestly negative to neutral.
- Macro/market context shows risk assets softening and stablecoin liquidity contracting, with sentiment currently in extreme fear (F&G 12).
- Market breadth is flat on the current horizon, and BTC correlation remains near zero over 72 hours, suggesting idiosyncratic BNB action could diverge from BTC.
ETF Flows (BTC/ETH)
Context note: ETF data here reflects BTC and ETH ETFs only and provides a risk backdrop rather than a direct signal for BNB. In the latest read, BTC ETFs show positive flows: +$629.8M for 1D, +$198.4M for 5D, and +$585.2M for 10D, while ETH ETFs show +$101.2M (1D), -$20.8M (5D), and +$81.6M (10D). These figures indicate sustained risk-on appetite in broad crypto markets, which can influence overall market sentiment even if not directly translatable to BNB moves.
What to Watch Next
- Monitor 1h close relative to 629 resistance for a potential breakout toward 641.67–654.25.
- Watch for a close below 604 to confirm downside projection toward 592.33 – 580.24.
- Keep an eye on BTC ETF flow momentum and BTC dominance indicators as a supplementary risk-context signal.
- Assess any shifts in volatility regime: a move from Very Low toward higher σ24h could precede sharper moves in BNB.
Hashtags: #BNBAnalysis #CryptoMarkets #TechnicalAnalysis #ETFFlows #BTCETF #ETHETF #MarketSnapshot #CryptoNews #TradingSignals #RiskOn #CryptoOutlook