Market Snapshot
Solana (SOL) sits near notable support around 67.3 and resistance near 70, within a range basis. The model indicates a sideways to bearish outlook in the near term, with a compressed volatility regime and an overarching risk-off market environment as evidenced by cross-market softness and extreme fear readings in broader sentiment measures.
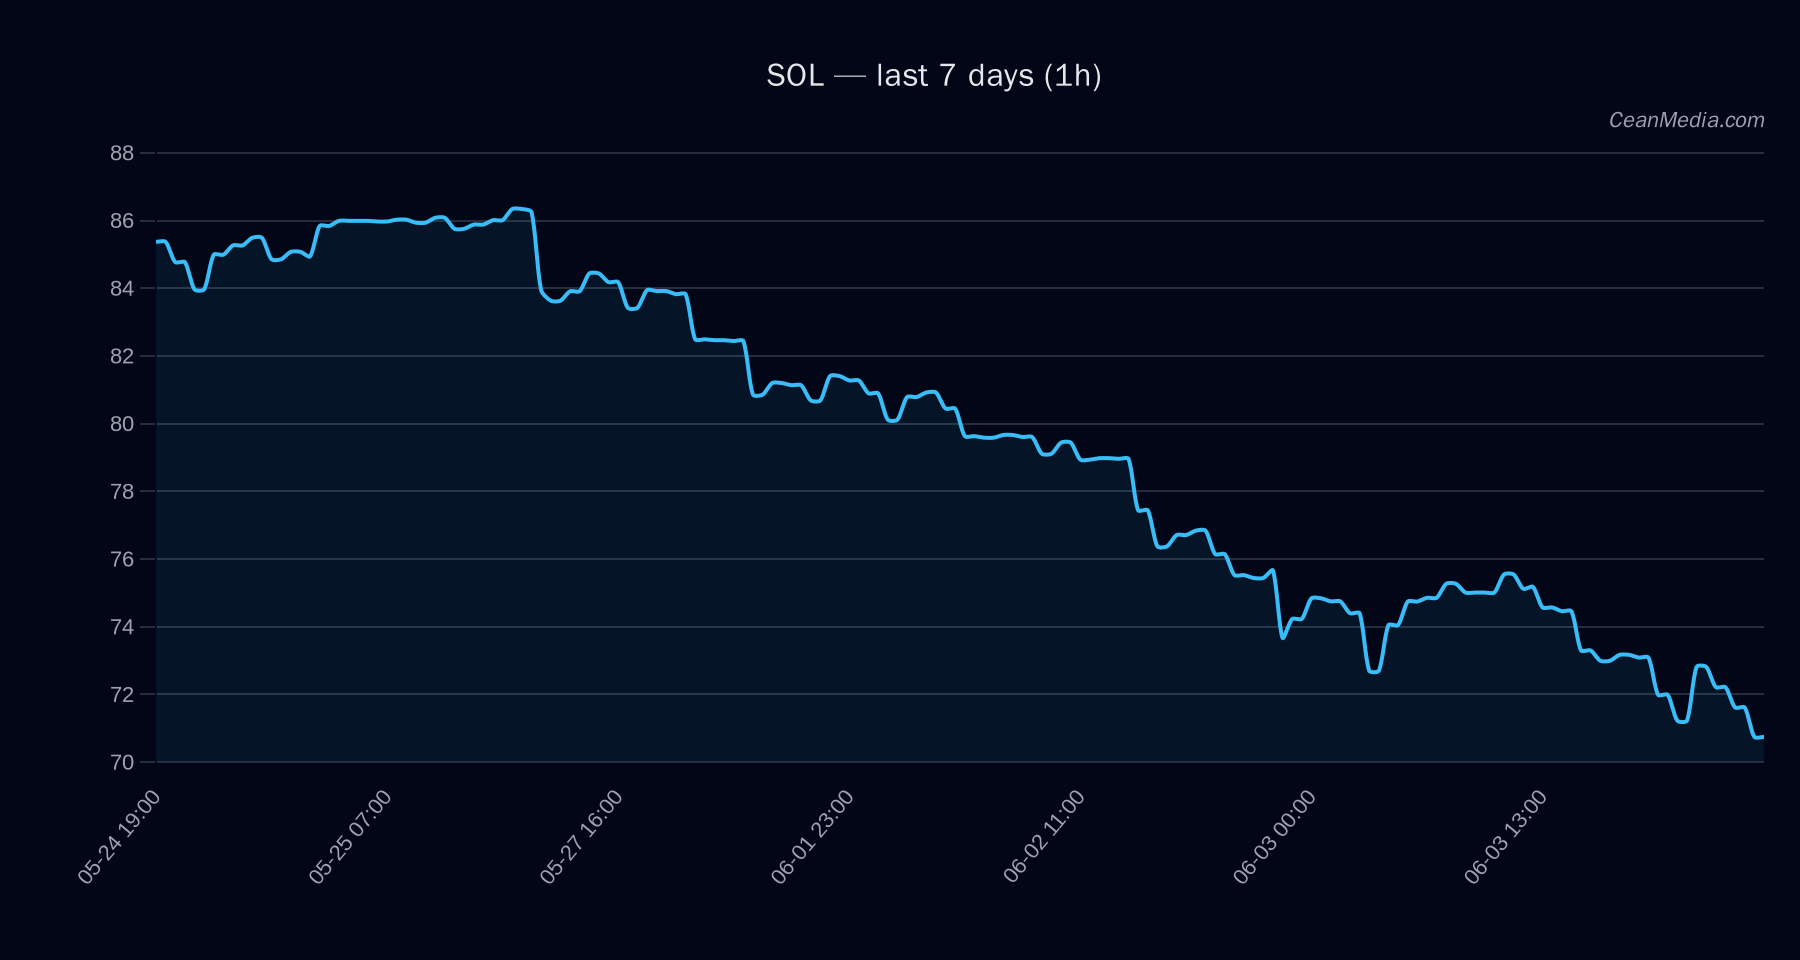
Technical Analysis: SOL
- Bearish (certainty 79/100)
- 68.66
- Bearish; RSI at 24. EMA12 < EMA26, SMA50 < SMA200; σ24h 1.26%; Vol regime: Low
- Sideways (8% likelihood); Up 46% | Side 8% | Down 47%
- 74.38; P20-P50-P80: 60.06 – 74.38 – 78.55
- Levels: Support near 67.3 (major 67.3); Resistance near 70 (major 70); Major resistance at 79.9; Breakouts: Break above 70 targets 71.43–72.83; Break below 67.3 targets 65.94–64.60
- Up: 1h close > 70 → 71.43 / 72.83; Down: 1h close < 67.3 → 65.94 / 64.60
- Inside range; no breakout confirmation from current levels; RSI indicates oversold conditions.
Drivers
- Top model drivers include: SPREAD Z-SCORE, STABLE MCAP Z-SCORE, and ORDER-BOOK IMBALANCE (EMA5).
- Momentum/volatility signals show a low vol regime with weak price momentum; BTC-related factors remain influential given BTC correlation at 0.87 over 72h.
- Macro/market context indicates risk assets softness and extreme fear in sentiment, with stablecoin liquidity contracting (7D).
ETF Flows (BTC/ETH)
Note: ETF flow data shown here relates only to BTC and ETH ETFs and is presented for context. It is not a primary signal for SOL and should be interpreted as macro risk-on/off backdrop rather than SOL-specific guidance.
- BTC ETF: +$629.8M (1D), +$198.4M (5D), +$585.2M (10D)
- ETH ETF: +$101.2M (1D), -$20.8M (5D), +$81.6M (10D)
What to Watch Next
- Monitor 1h closes around 70 for a potential breakout confirmation to the 71.43–72.83 range if price sustains above 70.
- Watch for a break below 67.3 which could open the 65.94–64.60 zone, signaling further correction.
- Observe changes in BTC correlation and BTC/ETH ETF flow dynamics as a broader risk-on/off indicator.
- Keep an eye on volatility regime shifts, as a move from low to increased volatility could reframe risk assessment for SOL.
Hashtags: #Solana #SOL #CryptoAnalysis #MarketUpdate #TechnicalAnalysis #ETFFlows #BTC #ETH #CryptoMarkets #RiskOnOff #Bitcoin #Ethereum