Market Snapshot
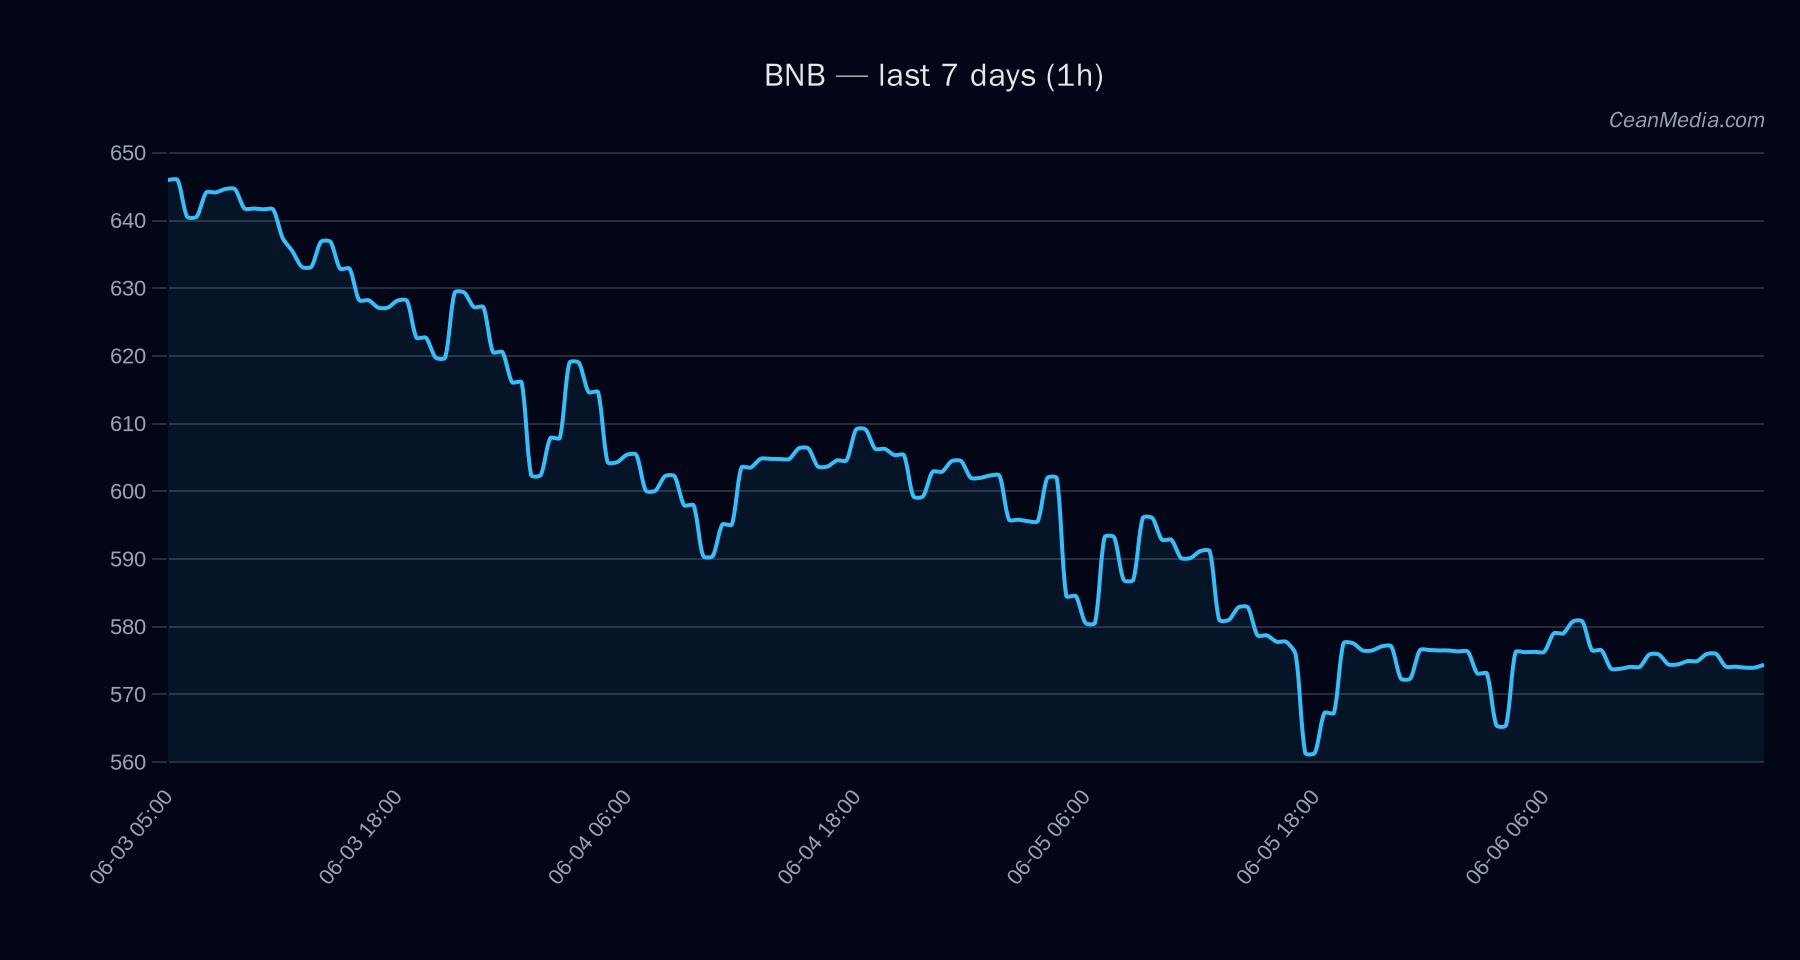
As of 2026-06-06, BNB traded near the mid-$570s with a bearish tilt in the short-term technical picture. Market breadth and cross-asset signals show risk-off sentiment in broader markets, while BTC/ETH ETF flows indicate continued institutional interest, albeit within a context that should not be conflated with direct BNB signals.
Technical Analysis: BNB
Bias: Bearish (certainty 52/100). Composite score: -3.6. Data quality: 95% complete; snapshot age minimal.
Price: Close 574.46.
Model forecast: Sideways with a low probability of breakout. Probabilities: Up 45%, Sideways 8%, Down 46% (forecast horizon ~24 hours).
Technical trend: Bearish. RSI 45. Indicators: EMA12 < EMA26, SMA50 < SMA200, low volatility regime (σ24h 0.72%), very low volume regime.
Levels:
Support near 563 (major), next strong level at 596 (major). Resistance near 586 (major), with 607 as a higher-level target on a breakout.
Triggers:
Up: 1h close > 586 → potential move to 597.67–609.39.
Down: 1h close < 563 → potential move to 551.71–540.45.
Invalidation / Notes: Price remains between the defined support and resistance bands. The model is bearish with RSI neutral; trigger confirmation required for directional conviction.
Drivers
- Top model drivers indicate a modest negative tilt from breakout dynamics and negative momentum on basis and order-flow signals.
- Momentum indicators show a subdued trend strength; divergence between short-term EMA slope and longer-term moving averages supports a cautious stance.
- BTC dominance at 56.1% with a slight negative delta over 24h suggests cross-market risk-off pressure, though not a leading signal for BNB-specific moves.
ETF Flows (BTC/ETH)
Contextual data: BTC/ETH ETF flows show ongoing institutional interest in traditional crypto assets, with BTC ETFs reporting positive flows (1D +$629.8M, 5D +$198.4M, 10D +$585.2M) and ETH ETFs also showing positive but smaller near-term inflows (1D +$101.2M, 5D -$20.8M, 10D +$81.6M).
Interpretation: ETF flow activity is a useful macro-context indicator for risk appetite, generally associated with risk-on or risk-off phases. In this instance, the data signals continued liquidity support for BTC exposure, which can reflect broader risk sentiment but should be treated as contextual rather than a primary signal for BNB. The BNB-specific outlook remains driven by internal technicals and market microstructure rather than ETF flows alone.
What to Watch Next
- Watch for a close above 586 on a 1-hour timeframe to test 597.67–609.39.
- Monitor a break below 563 to target 551.71–540.45 as potential intraday downside.
- Maintain awareness of cross-asset risk-on/off shifts, particularly BTC dominance and NASDAQ-related risk signals, which can influence altcoins indirectly.
- Observe volatility regime and volume changes for signs of regime shift from Very Low to higher activity which could precede a breakout.
Hashtags: #BNB #TechnicalAnalysis #MarketSnapshot #ETFFlows #CryptoMarkets #BTC #ETH #RiskOn #RiskOff #Altcoins