Market Snapshot
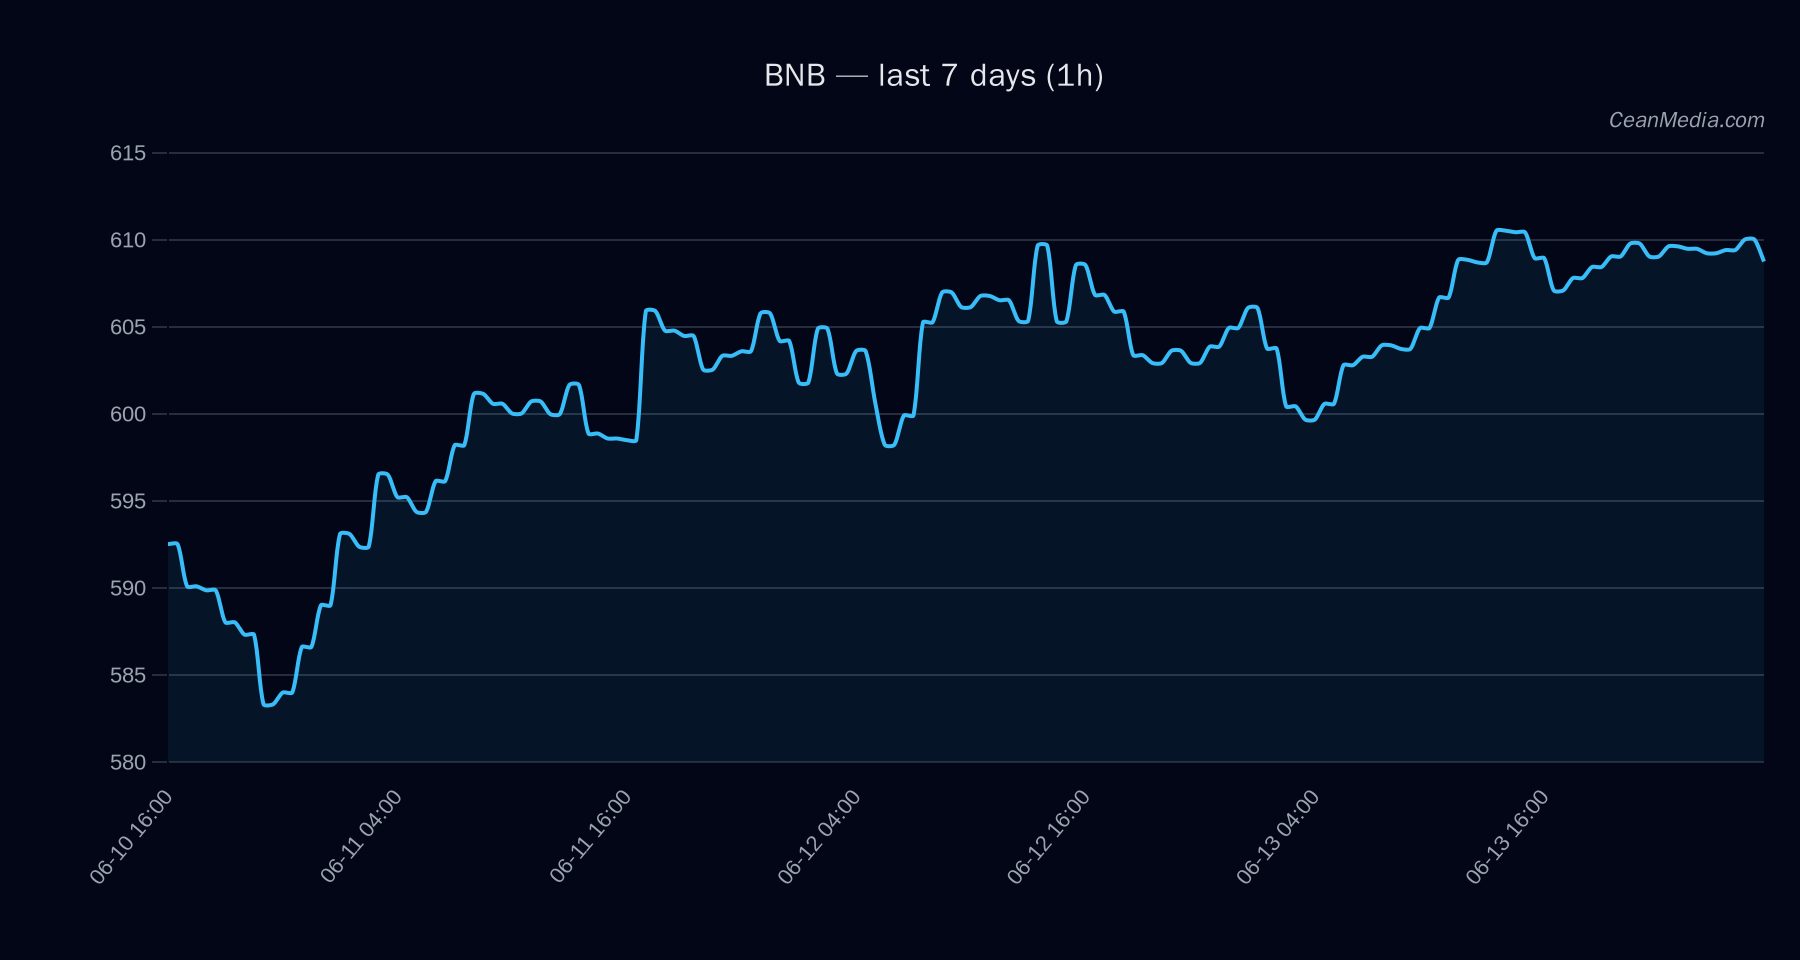
BNB is consolidating near key support and resistance levels with a mixed to bullish pressure profile. The current close is 609.44, and the model indicates a down bias on a 24-hour horizon with a probability split of roughly 51% down, 38% up, and 11% sideways. Market context shows very low volatility and a breadth reading indicating broad strength (>50%) across the market, with BTC correlation above 0.85. ETF flows for BTC and ETH are provided to contextualize risk appetite, but should not be used as a primary signal for BNB trading decisions.
Technical Analysis: BNB
- mixed / bullish pressure; certainty low (5/100).
- +1.3; conflicts 2.
- TA trend bullish; RSI 58. EMA12>EMA26; SMA50>SMA200; σ24h 0.17%; Vol regime: Very low.
-
- Support near: 597
- Major support: 583
- Resistance near: 622
- Major resistance: 639
- Forecast range P20-P80 = 579.20 – 630.86; P50 = 605.06; current price ~608.76–609.44 depending on feed
-
- Up: 1h close > 622 → target 634.06 / 646.49
- Down: 1h close < 597 → target 585.31 / 573.36
- Breakouts not yet confirmed; current context shows no breakout confirmation.
Drivers
- Return 24h, EMA slope, Funding Z-score, Basis Z-score, Order-book imbalance (EMA5), BTC Return 24h
- Very low volatility regime; BTC dominance around 56.6%; breadth 100% above SMA50; BTC/Alt breadth strong
- Cross-market risk assets supportive; stablecoin liquidity contracting; sentiment indicates fear (F&G 18)
- Funding Z-score and Basis Z-score contribute negative signals, while BTC momentum provides modest positive input
ETF Flows (BTC/ETH)
The ETF flow data provided covers BTC and ETH only and should be interpreted as context for risk appetite rather than a primary signal for BNB. BTC ETFs show a positive 1D flow (+$85.9M) with multi-day negative pressure (-$319.3M over 5D, -$120.9M over 10D). ETH ETFs show negative flows across 1D (-$4.9M), 5D (-$14.8M), and 10D (-$35.6M). These patterns suggest a cautious or slightly risk-off environment in the Bitcoin and Ethereum spaces, but do not directly translate into actionable signals for BNB without corroborating asset-specific indicators.
What to Watch Next
- Watch for a 1h close above 622 to validate upside continuation toward 634–646.
- Monitor if price breaks below 597 to signal potential move toward 585–573.
- Observe shifts in BTC dominance and ETF flow momentum as risk appetite changes, noting these as supplementary context.
- Keep an eye on volatility regime shifts from very low to higher levels, which can alter trigger thresholds.
Hashtags: #BNB #CryptoAnalysis #TechnicalAnalysis #ETFFlows #BTC #ETH #MarketSnapshot #TradingSignals #CryptoMarkets