Market Snapshot
On 2026-06-14, SOL is trading around the mid-to-upper 60s with a bullish bias but only a moderate certainty. The primary model indicates a down skew over a 24-hour horizon, while the TA trend remains bullish based on short- and medium-term moving-average relationships and current RSI readings. Market breadth is strong, BTC correlation remains elevated, and the volatility regime for SOL is described as very low.
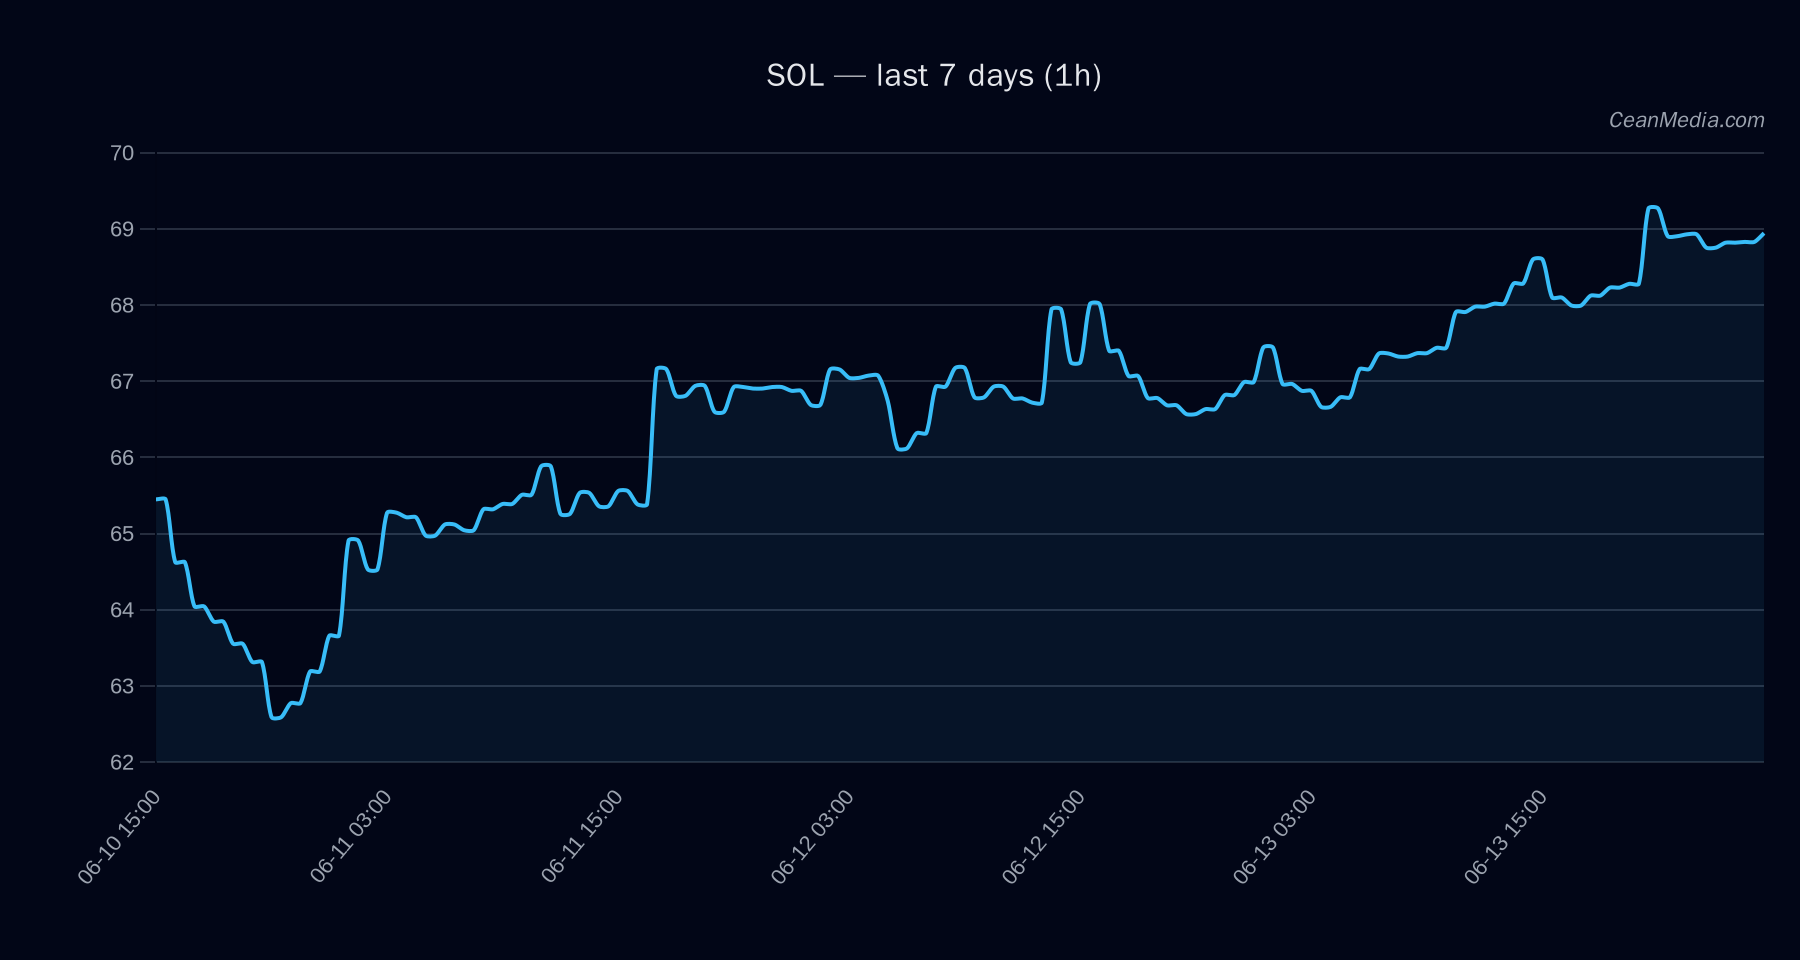
Technical Analysis: SOL
: +2.5 | conflicts 0 : bullish; RSI 65 : EMA12 > EMA26; SMA50 > SMA200; RSI 65; volatility (σ24h) 0.41%; very low vol regime
Forecast range (P20–P80): 62.70 – 73.43; P50 69.55
Levels to watch
Triggers
- Upward: 1h close > 70.3 ⇒ 71.76 – 73.16
- Downward: 1h close < 67.6 ⇒ 66.24 – 64.89
Invalidation: The analysis notes no breakout confirmation beyond current inside-range conditions; traders should monitor for resistance break or decisive bearish closes to alter posture.
Momentum context: Very low vol regime with positive token momentum signals (trend strength ~1.49) but mixed near-term directional probabilities (Forecast: down 47%, up 40%, sideways 13%).
Drivers
- Top model drivers emphasize balance between valuation and market stability: Stable MCAP Z-Score, FNG Value, and BTC-related factors contribute to the current reading.
- Key momentum/volatility signals: EMA slope, break distance from MA, and BTC return in the last 24h show modest positive input, while funding and basis Z-scores present mixed influence.
- Market breadth and BTC dominance remain supportive, with BTC correlation at 0.88 over 72 hours.
Note: The data indicate SOL-specific TA signals are bullish, but overall forecast momentum is mixed with a downside bias in the 24-hour horizon. Use trigger levels for confirmation.
ETF Flows (BTC/ETH)
ETF flow data provided is limited to BTC and ETH and should be interpreted as context rather than a primary signal for SOL. Recent figures show:
- BTC ETF: +$85.9M (1D); 5D: -$319.3M; 10D: -$120.9M
- ETH ETF: -$4.9M (1D); 5D: -$14.8M; 10D: -$35.6M
Interpretation: Net BTC ETF inflows suggest a short-term risk-on tilt for broader crypto markets, while ETH ETF flows point to modest outflows. This context can influence liquidity and sentiment but is not a direct SOL signal. Traders should integrate this with SOL-specific TA and on-chain signals.
What to Watch Next
- Monitor 1h closes around or above 70.3 to test the upper trigger zone toward 71.76–73.16.
- Watch for a close below 67.6 (next levels 66.24–64.89) to validate a near-term push lower.
- Observe changes in volatility regime and intraday breadth, as persistent low vol with rising breadth could precede a breakout.
- Keep an eye on BTC/ETH ETF flow shifts as a contextual signal for market risk appetite, even though not a primary SOL signal.
Hashtags: