Market Snapshot
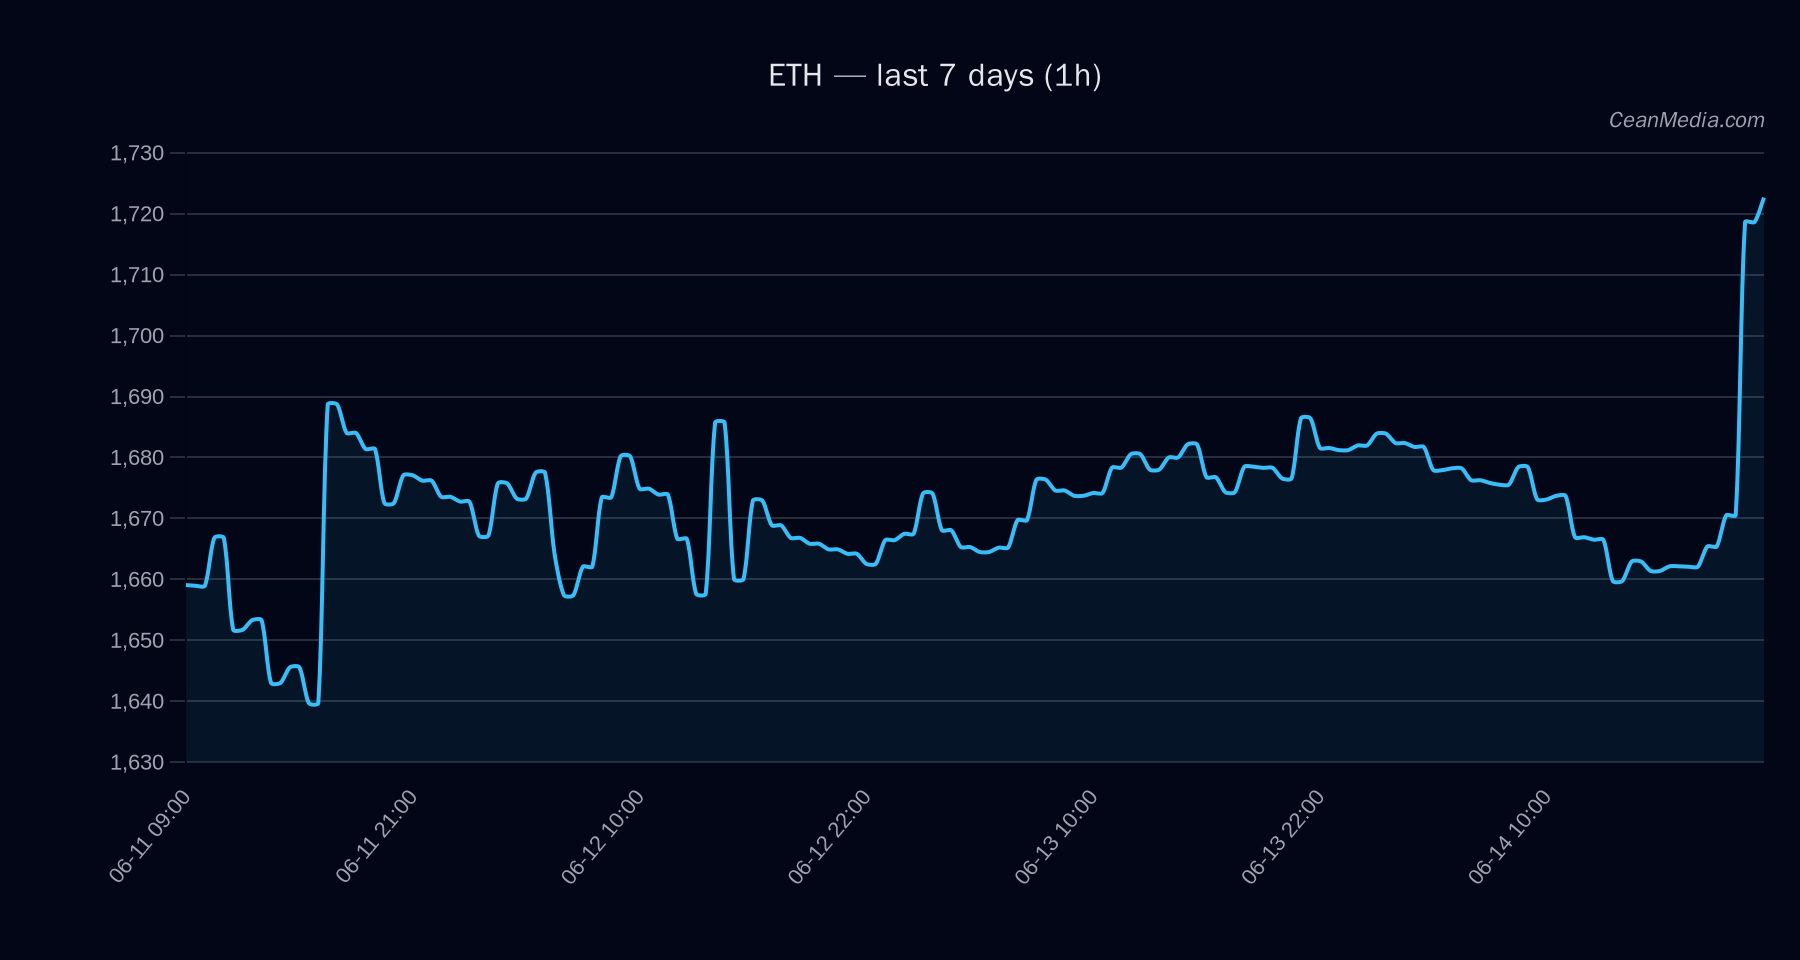
Ethereum (ETH) is trading in a mixed territory as of the latest close around 1,723.49. The model indicates a down bias with mixed certainty (8/100) despite a bullish TA trend signal. Price action sits within a defined range, with potential intraday triggers noted on a break above 1,758 or below 1,690. Overall breadth is strong (>50h), and BTC correlation remains elevated (rho 0.94 over 72h), suggesting broad market influences are relevant in the near term.
Technical Analysis: ETH
- : Mixed/bullish pressure with low certainty (8/100).
- : +1.4; conflicting signals noted.
- : Close around 1,723.49.
- : Bullish indicators prevail: EMA12>EMA26, SMA50>SMA200, RSI 80, volatility regime: very low (σ24h 0.61%). RSI is in overbought territory.
- : Model signals a down bias (52%), with up 38%, sideways 10%.
- :
- Support: near 1,690; Major: 1,628.
- Resistance: near 1,758; Major: 1,820.
- :
- Up: Close > 1,758 -> targets ~1,793.12 to 1,828.28.
- Down: Close < 1,690 -> targets ~1,655.24 to 1,621.46.
- : Breadth is positive (100% above SMA50); BTC correlation is high (0.94); ETF activity for ETH is negative over 5-10 days in BTC terms, suggesting limited bullish fuel from ETH-specific ETF flows at present.
Drivers
: - RETURN 24H: 0.02
- EMA SLOPE: 0.0043
- FUNDING Z-SCORE: -0.113
- BASIS Z-SCORE: 0.278
- ORDER-BOOK IMBALANCE (EMA5): -0.338
- BTC RETURN 24H: 0.015
- : Trend strength 0.80 suggests ongoing upside momentum; volatility regime is very low, implying tighter price action and potential for quick reaction to triggers.
ETF Flows (BTC/ETH)
Note: ETF flow data shown here reflects BTC/ETH ETF activity and is provided for context only. It is not the primary signal for ETH trading decisions. As of the latest data, BTC ETFs show net inflows on the 1D horizon (+$85.9M) but ETH ETFs display net outflows on 1D (-$4.9M) with larger declines over 5D and 10D horizons. This pattern suggests a cautious stance from ETF investors toward ETH relative to BTC in the short term, potentially reflecting risk-off positioning or liquidity considerations rather than direct ETH price signals.
: +$85.9M (1D); -$319.3M (5D); -$120.9M (10D) : -$4.9M (1D); -$14.8M (5D); -$35.6M (10D)
What to Watch Next
- Watch for a close above 1,758 to confirm upside continuation toward 1,793.12 and 1,828.28.
- Monitor breakdown below 1,690 for potential acceleration toward 1,655.24 and 1,621.46.
- Keep an eye on RSI behavior as price holds near overbought territory to assess risk of a pullback within the bullish framework.
- Consider broader macro context and BTC dynamics, given high BTC/ETH correlation and overall risk sentiment shifts when interpreting ETH moves.
Hashtags: #ETH #Ethereum #TechnicalAnalysis #MarketSnapshot #ETFFlows #CryptoNews #CryptoTrading #CryptoMarkets #BTC #Altcoins #Volatility #Liquidity