Market Snapshot
As of 2026-06-14, SOL sits between a near-term support at 69 and a resistance near 71.8, with a forecast suggesting a sideways move into the next 24 hours. The model assigns a bias of slightly bullish with a low certainty (22/100), and the composite score is +1.5 with zero conflicts. Market context shows very low volatility, strong breadth, and a BTC-correlated backdrop (ρBTC,72h ≈ 0.91).
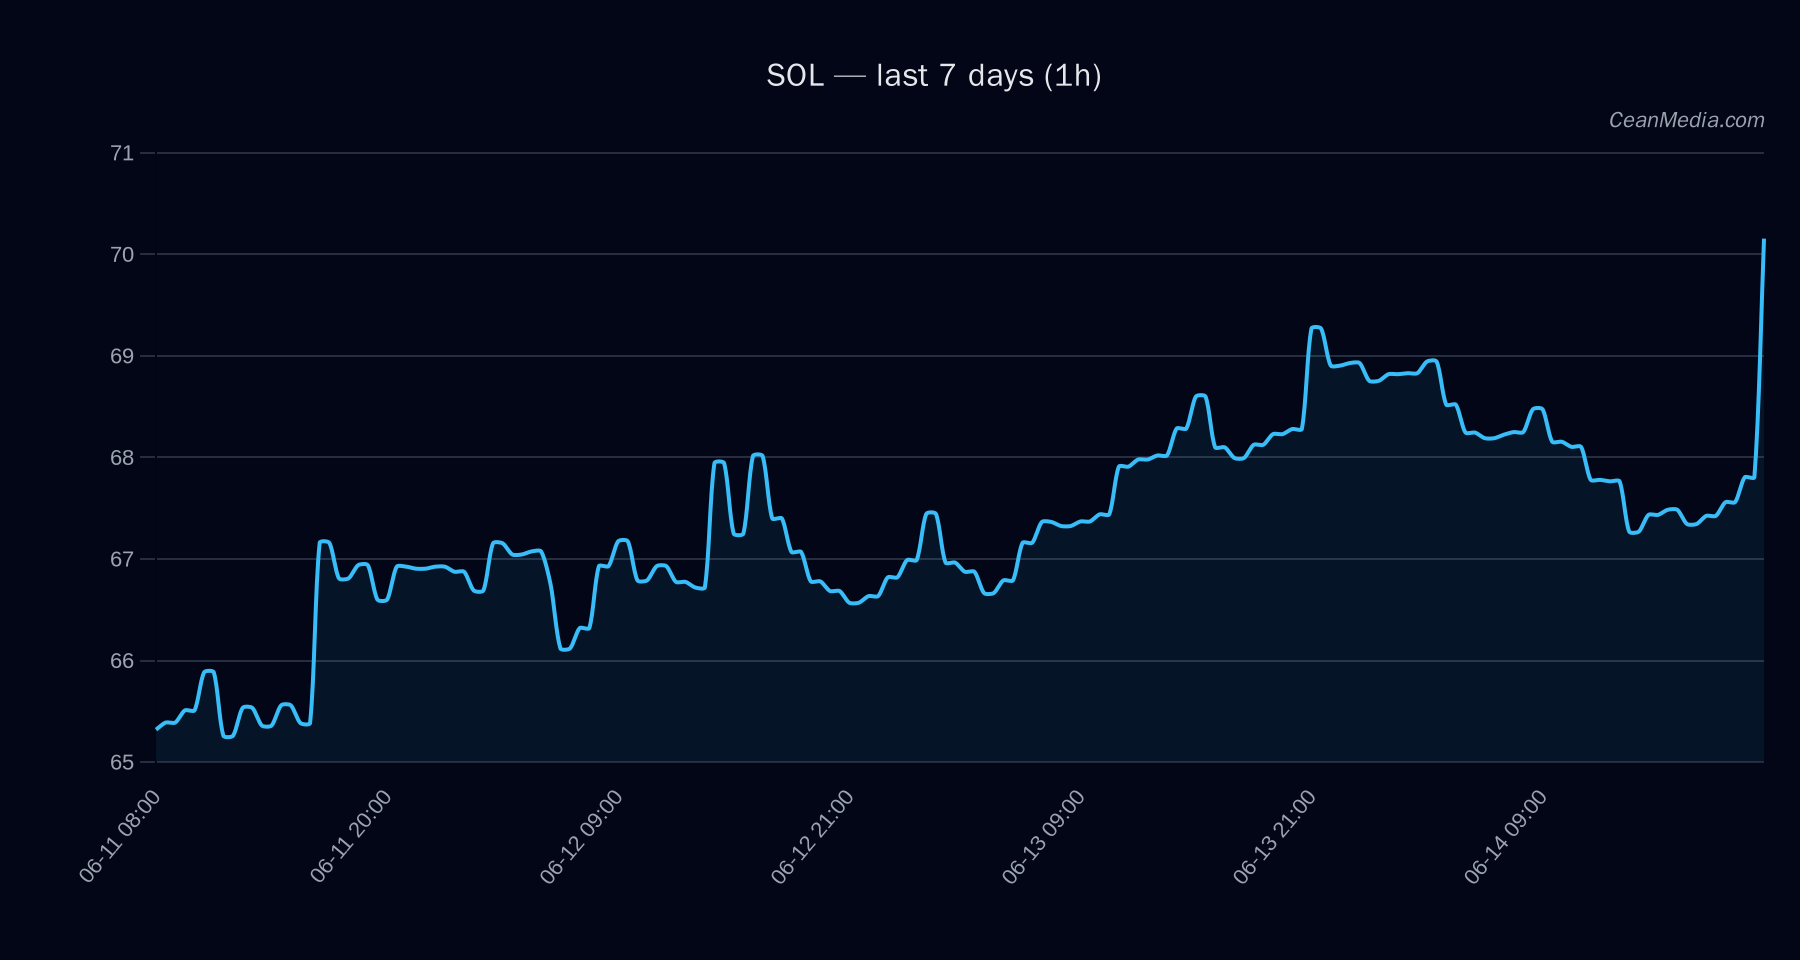
Technical Analysis: SOL
+1.5 70.36 EMA12>EMA26, SMA50>SMA200, RSI 75, σ24h 0.83%, Volatility regime: Very low
Drivers
Return 24h, EMA slope, Funding Z-score, Basis Z-score, Order-book imbalance (EMA5), BTC 24h return Very low volatility (vol regime) with continued breadth support; ETF data indicates mixed near-term flow dynamics in correlated assets Cross-market risk assets supportive; stablecoin liquidity contracting; sentiment in extreme fear
ETF Flows (BTC/ETH)
Contextual note: ETF flow data presented here relates only to BTC and ETH ETFs and is intended to provide market tone context, not a primary signal for SOL. Net directional flow in BTC ETFs shows a modest 1-day positive delta (+$85.9M) but a longer 5-/10-day negative trajectory, while ETH ETFs are negative over the same windows (-$4.9M 1D; -$14.8M 5D; -$35.6M 10D). This pattern can reflect shifting risk appetites but does not directly determine SOL price action.
1D +$85.9M; 5D -$319.3M; 10D -$120.9M 1D -$4.9M; 5D -$14.8M; 10D -$35.6M
What to Watch Next
- Watch for a close above 71.8 on an intraday basis to test 73.2–74.6 resistance
- If SOL breaks below 69, monitor for potential move toward 67.6–66.2
- Monitor BTC/ETH ETF flow signals as a contextual gauge for risk-on risk-off shifts
- Maintain awareness of volatility regime remaining very low, which can compress price moves
Hashtags: #solana #SOL #cryptomarket #technicalanalysis #etfflows #btc #eth #riskon #tradingview #tradinganalysis #marketupdate