Market Snapshot
BNB sits in a mixed technical stance as of 2026-06-16, with price near key support and resistance levels. The composite signal indicates low conviction with a bias leaning toward bearish pressure, amid very low volatility and a cautious market backdrop.
Technical Analysis: BNB
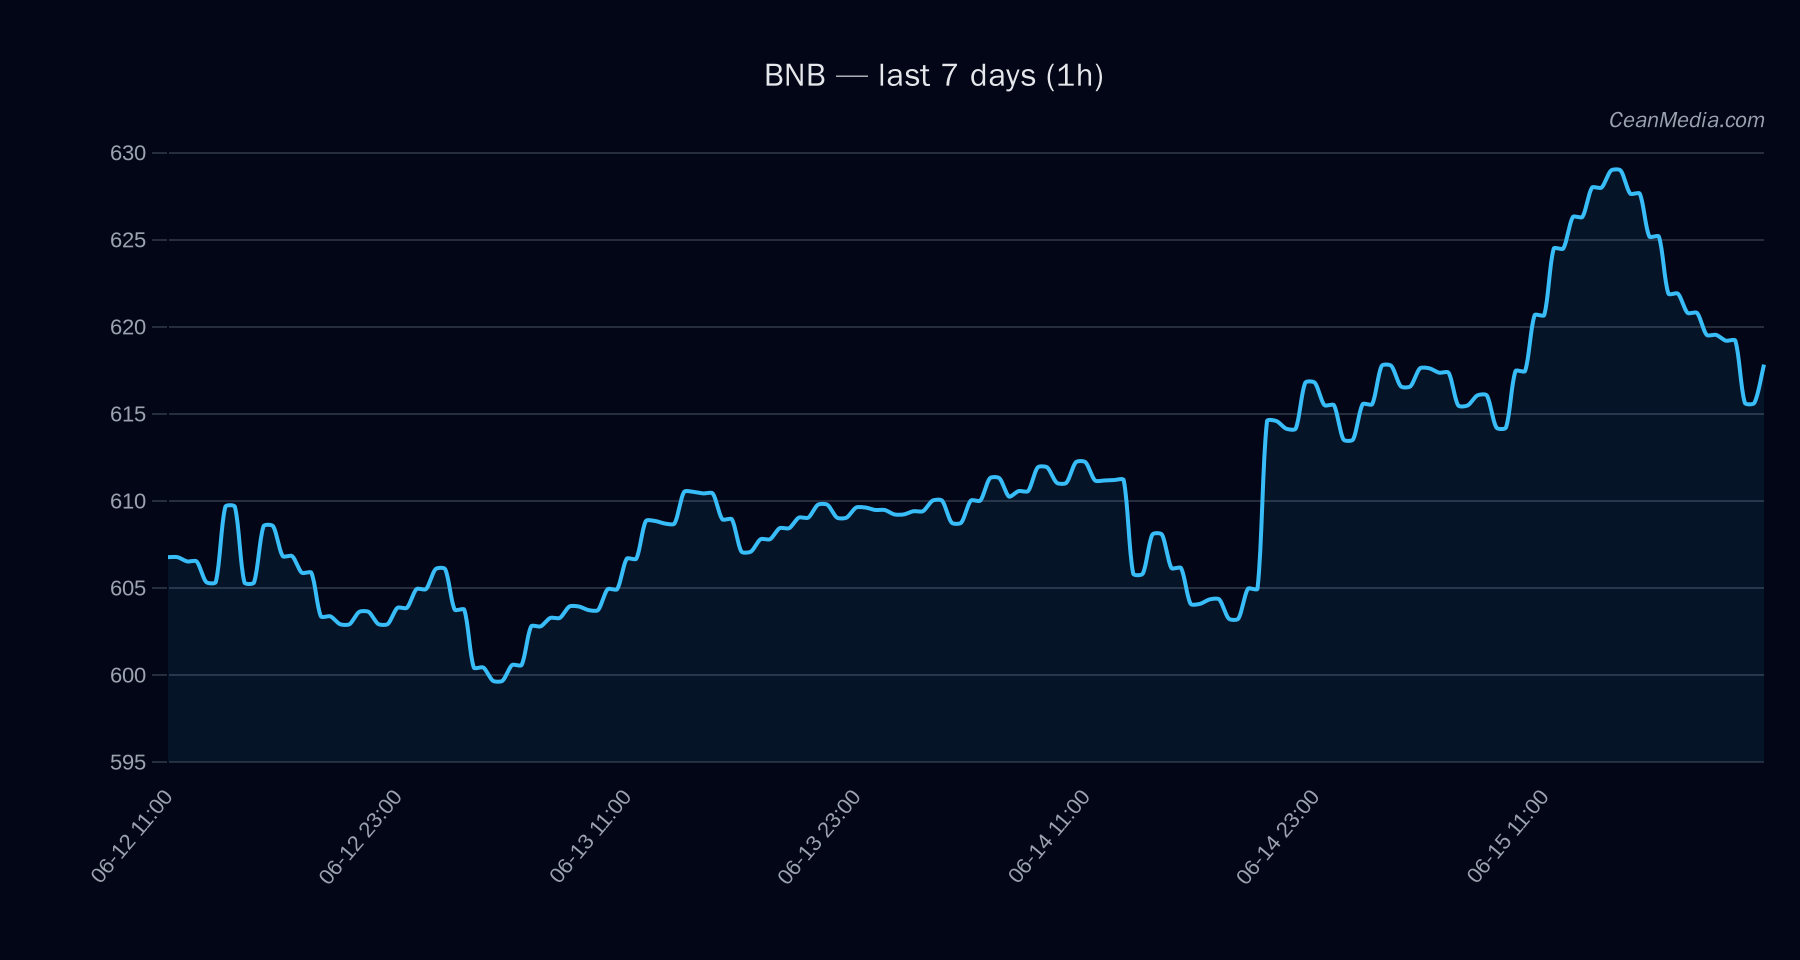
: Down (62%); Up 29% | Side 9% | Down 62%. : Bullish indicators observed: EMA12 > EMA26, SMA50 > SMA200, RSI 49.0; volatility σ24h = 0.34%; volume regime: Very Low. : - Support near 606; major support at 585
- Resistance near 630; major resistance at 651
- Up: 1h close > 630 -> potential targets 643.10 – 655.71
- Down: 1h close < 606 -> potential targets 593.65 – 581.54
: P20-P80 = 587.01 – 648.46; P50 = 612.87 : Evidence is not aligned; trend direction should be treated with caution until trigger confirmation. Breadth indicates broad participation above SMA50 (100%).
Drivers
: - Stable MCAP log1p: +1.37
- Stable MCAP Z-score: -1.33
- Spread BP: -1.31
- NASDAQ 100 5D: -1.10
- BTC DOMINANCE: +1.07
- SP500 5D: +1.05
: TA trend bullish but overall model suggests cautious outlook; RSI neutral; volatility regime very low; market breadth strong (100% above SMA50). : Fear/Extreme Fear signals persist; funding and basis z-scores remain negative, aligning with a cautious to bearish tilt in the near term.
ETF Flows (BTC/ETH)
Contextual information for risk sentiment; note that ETF flow data pertains to BTC and ETH only and is not a primary signal for BNB. The data suggests a mixed to supportive backdrop for risk assets in BTC, with ETH showing net outflows over the observed 1D and 5D windows.
: 1D +$85.9M; 5D -$319.3M; 10D -$120.9M : 1D -$4.9M; 5D -$14.8M; 10D -$35.6M
Interpretation: The BTC ETF data points to recent short-term inflows followed by larger outflows over mid-term horizons, suggesting cautious risk-on/off dynamics. ETH flows show modest outflows. Taken together, ETF signals provide a general market risk context but should not be used as a primary signal for BNB trading decisions.
What to Watch Next
- Watch for a close above 630 on a 1-hour or 4-hour chart to validate potential bullish triggers toward 643–656.
- Monitor if price breaks 606 to validate downside targets near 593–582.
- Observe changes in volatility regime and volume; a rise in σ24h or a shift to higher volume could alter the bias.
- Correlate with BTC dominance and ETH ETF flow shifts as a broader risk-on/off gauge, while keeping in mind BNB-specific signals prevail.
Hashtags: #BNB #CryptoAnalysis #TechnicalAnalysis #MarketSnapshot #ETFFlows #BTC #ETH #RiskOn #Altcoins #TradingStrategy #PriceLevels