Market Snapshot
Solana (SOL) is trading near key support and resistance, with a bias described as slightly bullish but with low certainty. The forecast range suggests a sideways drift in the near term, supported by low volatility and mixed macro signals. ETF flow data provided here covers BTC and ETH ETFs only and serves as contextual market sentiment rather than a primary SOL signal.
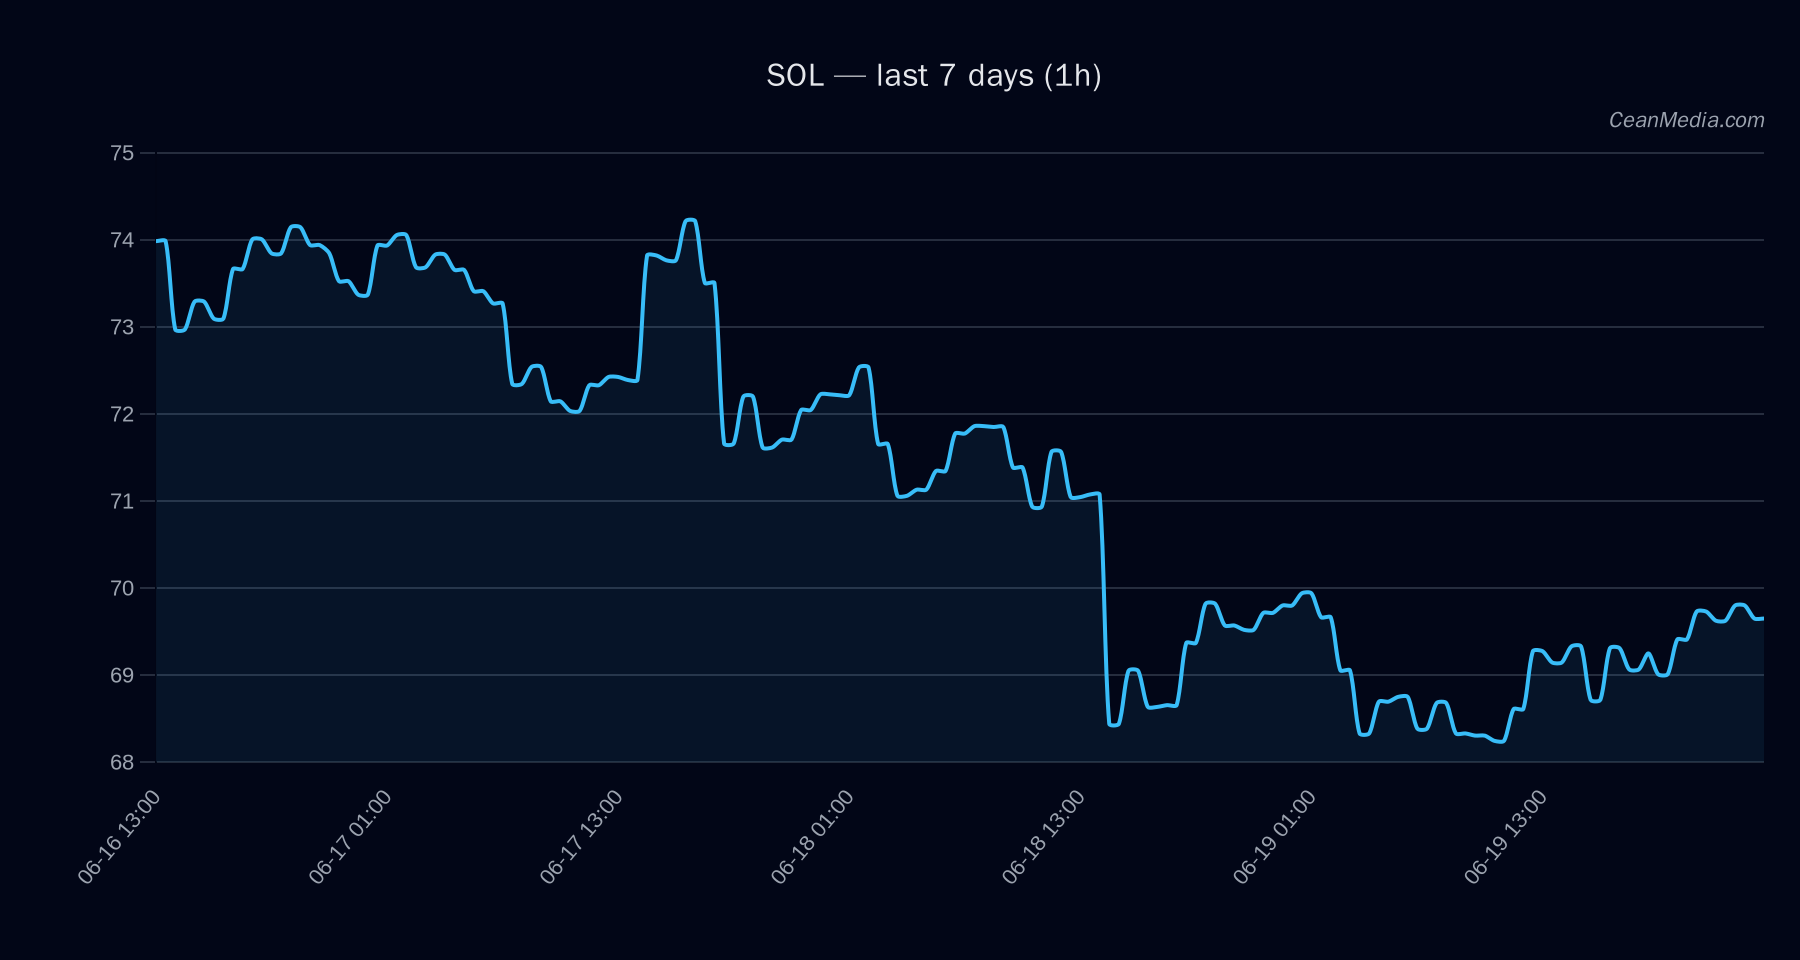
Technical Analysis: SOL
+1.0; conflicts 0. Sideways (4% probability assigned to sideways path; Up 47%, Down 49% per model), indicating a balanced near-term directional view. Sideways; RSI 57. EMA12 > EMA26, SMA50 < SMA200, RSI 57, 24h σ 0.54%, very low volatility regime. - Support: near 68.6
- Major Support: 65.3
- Resistance: near 71.4
- Major Resistance: 73.7
- Up: 1h close > 71.4 → target 72.828 and 74.256
- Down: 1h close < 68.6 → target 67.228 and 65.856
70.49; P20–P80: 62.66 to 77.25. Vol regime: Very low; Breadth > SMA50 = 33%; BTC correlation 0.94.
Drivers
NASDAQ100 RET 1D (+0.94 contri), RUSSELL2000 RET 1D (-0.53 contri), SPREAD BP (+0.41), BTC DOMINANCE (-0.33). Trend strength modest; BTC dominance shows a slight downward delta over 7 days. Overall, volatility is very low, which supports a range-bound dynamic. External factors such as cross-market risk sentiment and sector rotations contribute to the marginal upside/bias balance.
ETF Flows (BTC/ETH)
The ETF flow data provided is limited to BTC and ETH ETFs and should be interpreted as context for overall market sentiment rather than a direct SOL signal. Current indications show flows as follows:
1D -$90.7M; 5D -$141.6M; 10D +$83.0M. 1D -$12.8M; 5D -$14.9M; 10D +$76.4M.
Interpretation: Net negative near-term BTC ETF flows indicate modest risk-off pressure in the crypto universe, while ETH flows show a similar cautious trend. This data is context for SOL trading environments but is not a primary signal for SOL direction or targets.
What to Watch Next
- Monitor 1h closes around 71.4 for potential breakout toward 72.8–74.3 if resistance is broken.
- Watch for a sustained move below 68.6 to see if downside targets of 67.2–65.9 come into play.
- Keep an eye on market breadth and BTC dominance trends, which can influence risk sentiment and SOL correlations.
- Observe volatility regime shifts; a move from very low to higher volatility could precede a directional breakout.
Hashtags: #solana #SOL #cryptoanalysis #marketoutlook #technicalanalysis #ETFflows #BTC #ETH #riskmanagement #tradingviews #blockchain