Market Snapshot
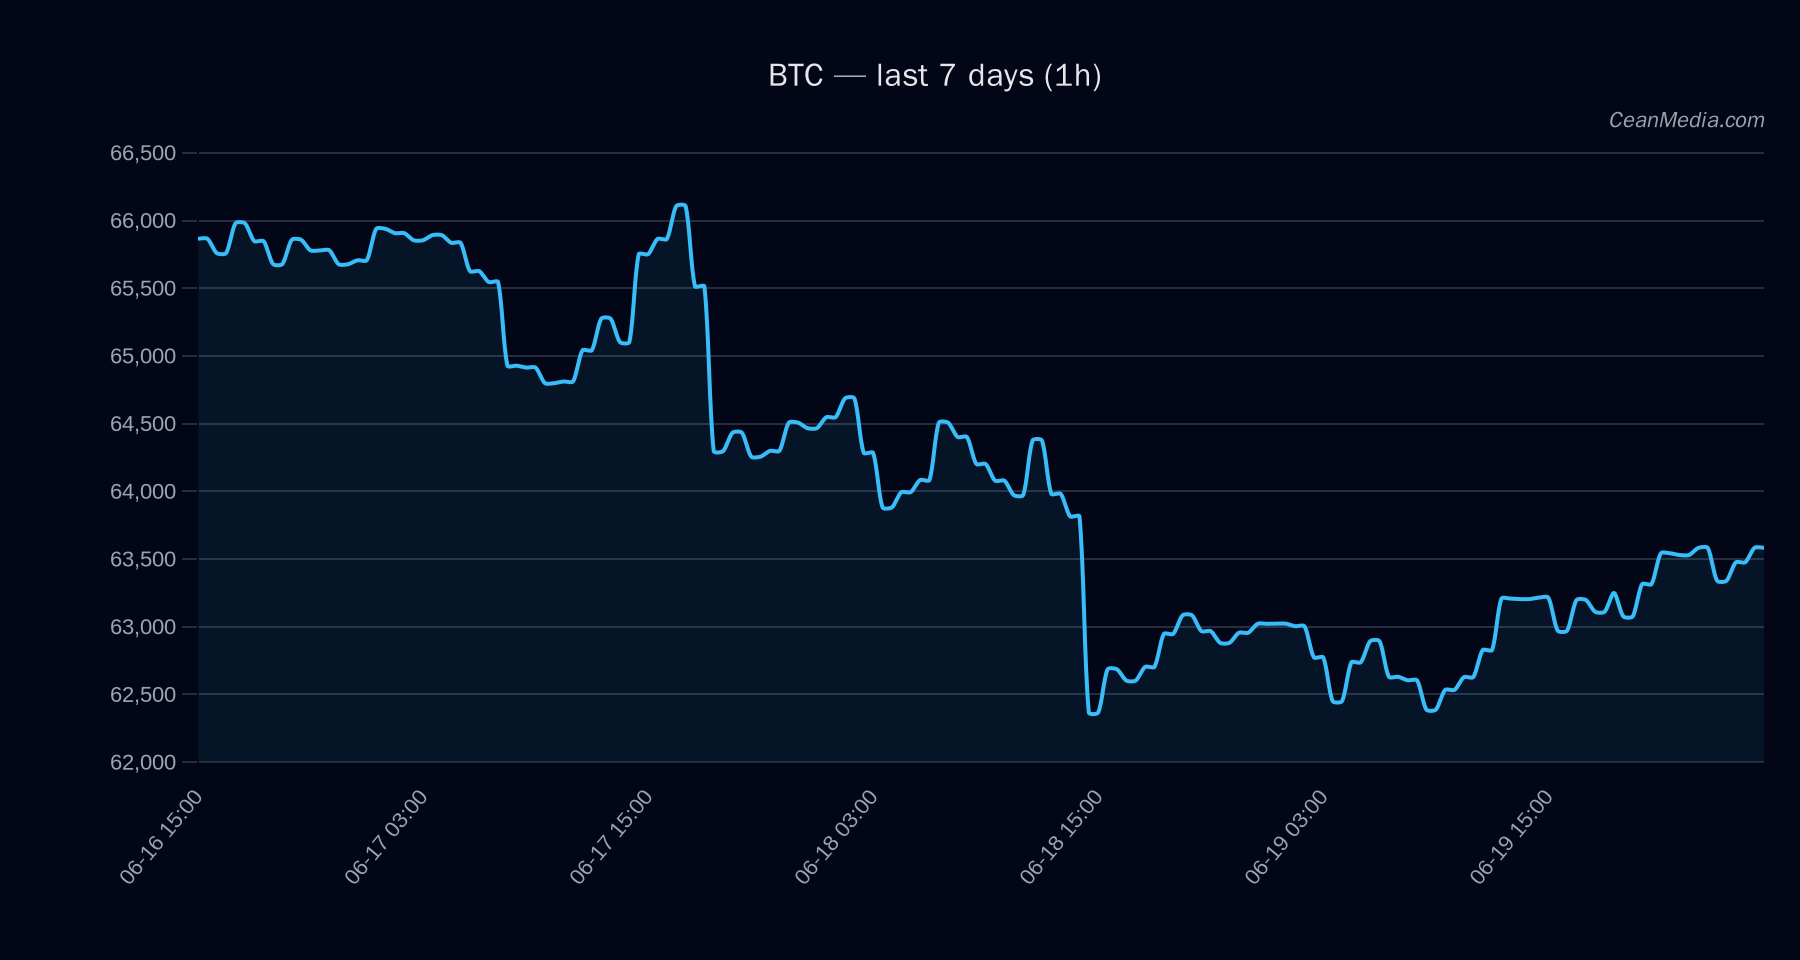
BTC trades in a narrow, sideways range with a close around 63,659.13. Market breadth remains robust for BTC, and volatility is very low. The composite model signals a mixed/neutral bias with low certainty, while macro conditions show cross-asset risk assets supportive but with subdued intraday movement. ETF flow data indicate BTC and ETH products have shifted modestly in the 1D to 10D windows, providing context rather than a primary signal for BTC price action.
Technical Analysis: BTC
63,659.13 EMA12 > EMA26, SMA50 < SMA200, σ24h 0.31%, Vol regime: Very low P50 63,570.81; P20-P80 58,797.60 – 67,463.85 - Up: close > 64,925 → target 66,231 – 67,530
- Down: close < 62,375 → target 61,138 – 59,891
Breakouts require confirmation; current context shows no breakout signal.
Drivers
Stable MCAP log1p, EMA slope, funding z-score, basis z-score, order-book imbalance (EMA5) Very low vol regime; BTC returns modest (0.02% ~ 0.018% 24h), RSI neutral Cross-market risk assets supportive; BTC dominance in gradual decline on a 7D basis
ETF Flows (BTC/ETH)
ETF flow data are provided for BTC and ETH and reflect 1D, 5D, and 10D windows. BTC ETF flows show net outflows in the 1D period and ongoing outflows in the 5D window, with 10D turning slightly positive. ETH ETF data show similar net outflows on shorter horizons but positive flow over 10D. These figures are contextual inputs and should not be treated as primary signals for BTC price direction.
1D: -$90.7M; 5D: -$141.6M; 10D: +$83.0M 1D: -$12.8M; 5D: -$14.9M; 10D: +$76.4M
What to Watch Next
- Watch for a close above 64,925 to validate a breakout scenario toward 66,231 – 67,530.
- Alternatively, a close below 62,375 would open downside targets near 61,138 – 59,891.
- Monitor ETF flow momentum in BTC and ETH as contextual signals rather than primary drivers.
- Observe changes in vol regime and breadth for signs of a shift from very low to higher volatility conditions.
Hashtags: #Bitcoin #BTCAnalysis #MarketSnapshot #TechnicalAnalysis #ETFFlows #CryptoMarkets #PriceAction #Liquidity #Volatility #Momentum #TradingStrategy #MarketContext