Market Snapshot
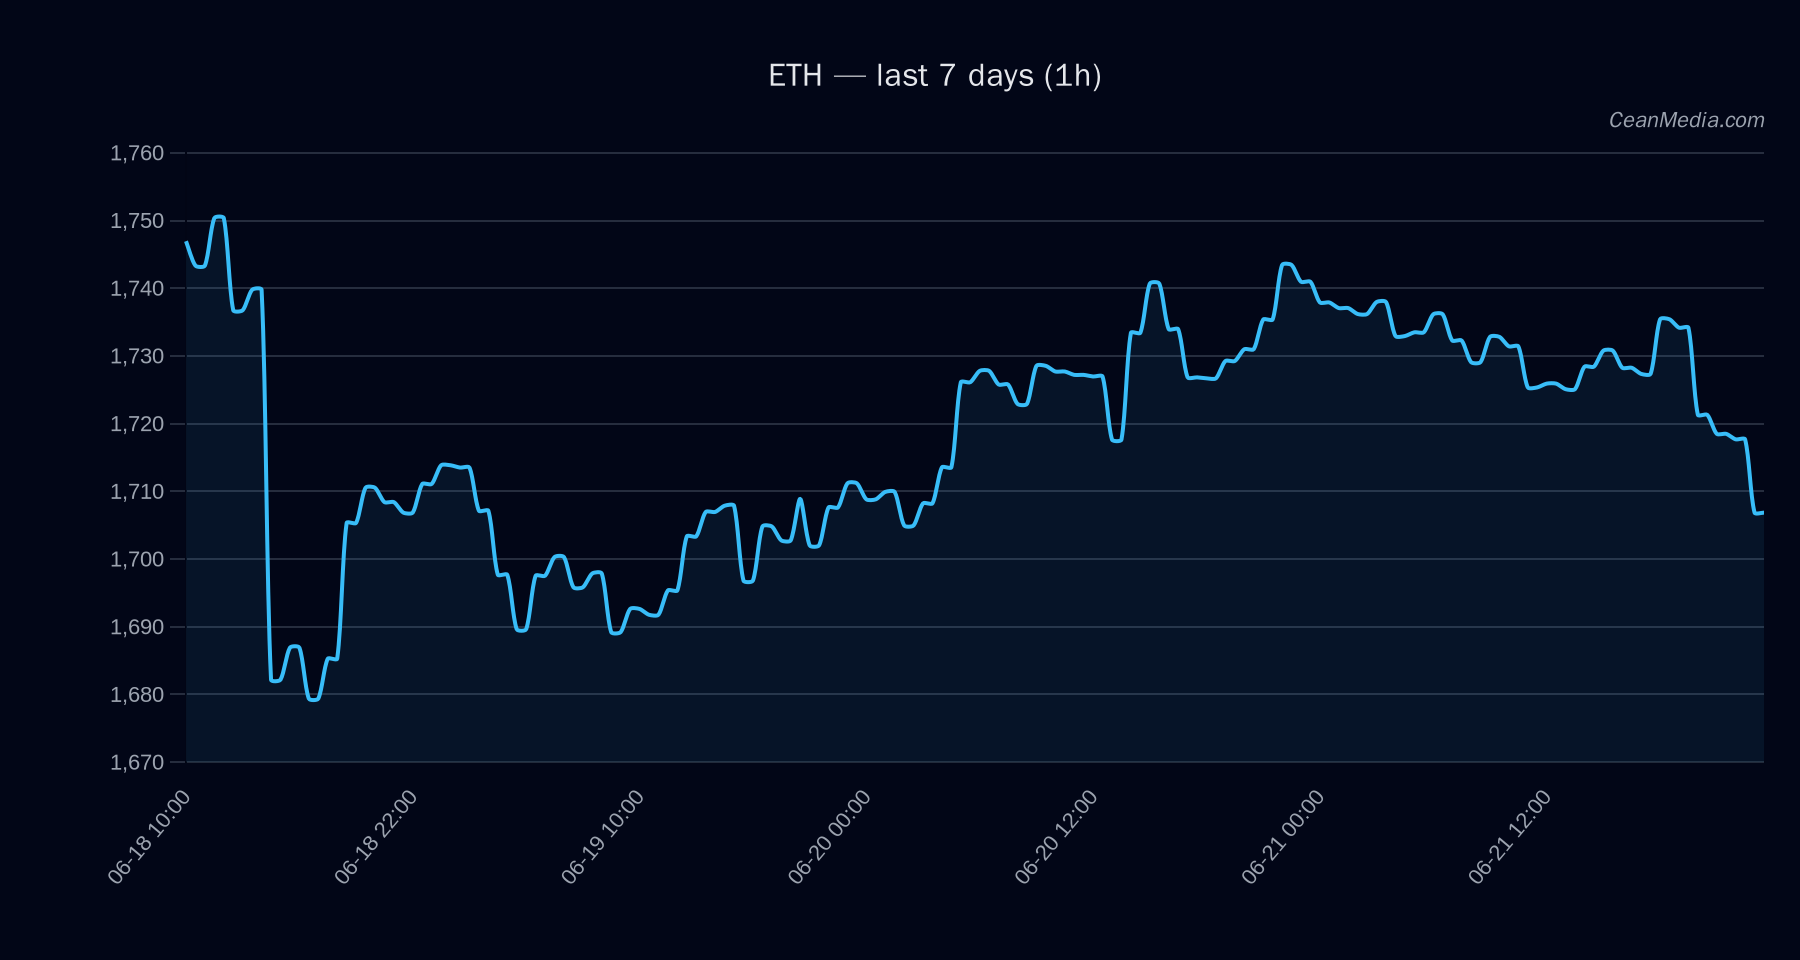
ETH traded around the 1,720 area with a bearish tilt in the immediate term. The composite model shows a negative bias, with a sideways forecast dominant at a 12% probability, while the price remains within a defined range. Market breadth is low, and volatility remains very low, signaling a muted backdrop despite ongoing macro concerns.
Technical Analysis: ETH
- EMA12 < EMA26
- SMA50 < SMA200
- RSI 43
- Volatility regime: Very low (σ24h 0.23%)
- Support near 1,686; Major support 1,638
- Resistance near 1,756; Major resistance 1,774
- Up trigger: 1h close > 1,756 ⇒ potential move toward 1,790.52–1,825.63
- Down trigger: 1h close < 1,686 ⇒ potential move toward 1,652.84–1,619.11
1,719.42; P20–P80: 1,539.83 – 1,858.78
Drivers
- FNG VALUE: -3.44 (contrib 0.41)
- SPREAD BP: value 1.09
- BTC DOMINANCE: -1.1
- BTC VOL REGIME: -1.52
- BTC RV 24H: -0.9
- TREND STRENGTH: +1.33
Breadth approx. 17% above 50-SMA; BTC correlation 0.88; Vol regime remains very low
ETF Flows (BTC/ETH)
Note: ETF flow data included here is limited to BTC and ETH ETFs and provides context on macro risk sentiment rather than a primary signal for ETH price moves.
1D -$90.7M; 5D -$141.6M; 10D +$83.0M 1D -$12.8M; 5D -$14.9M; 10D +$76.4M
Interpretation: ETF flow data can reflect appetite for crypto-related products and risk-on/off sentiment in broader markets. BTC flows are notably heavier than ETH on short horizons, which can signal overall risk-off tendencies when negative, but should not be treated as a primary ETH signal. The current data suggests a cautious environment with mixed ETF positioning; ETH-specific activity remains modest relative to BTC.
What to Watch Next
- Watch for a close above 1,756 on a 1-hour basis to confirm a potential short-term shift toward 1,790–1,825.
- Monitor a break below 1,686; if it occurs, assess risk for a move toward 1,652–1,619.
- Maintain awareness of BTC-led risk signals as BTC dominance and volatility regimes remain influential in the broader market sentiment.
- Keep an eye on overall breadth and alt-coin performance as signs of a potential regime change may appear in the near term.
Hashtags: #ETHMarketView #EthereumAnalysis #TechnicalAnalysis #ETFFlows #CryptoMarkets #BTCETHCorrelation #MarketBreadth #VolatilityWatch #RiskSentiment #CryptoETF #PriceLevels #TradingStrategy