Market Snapshot
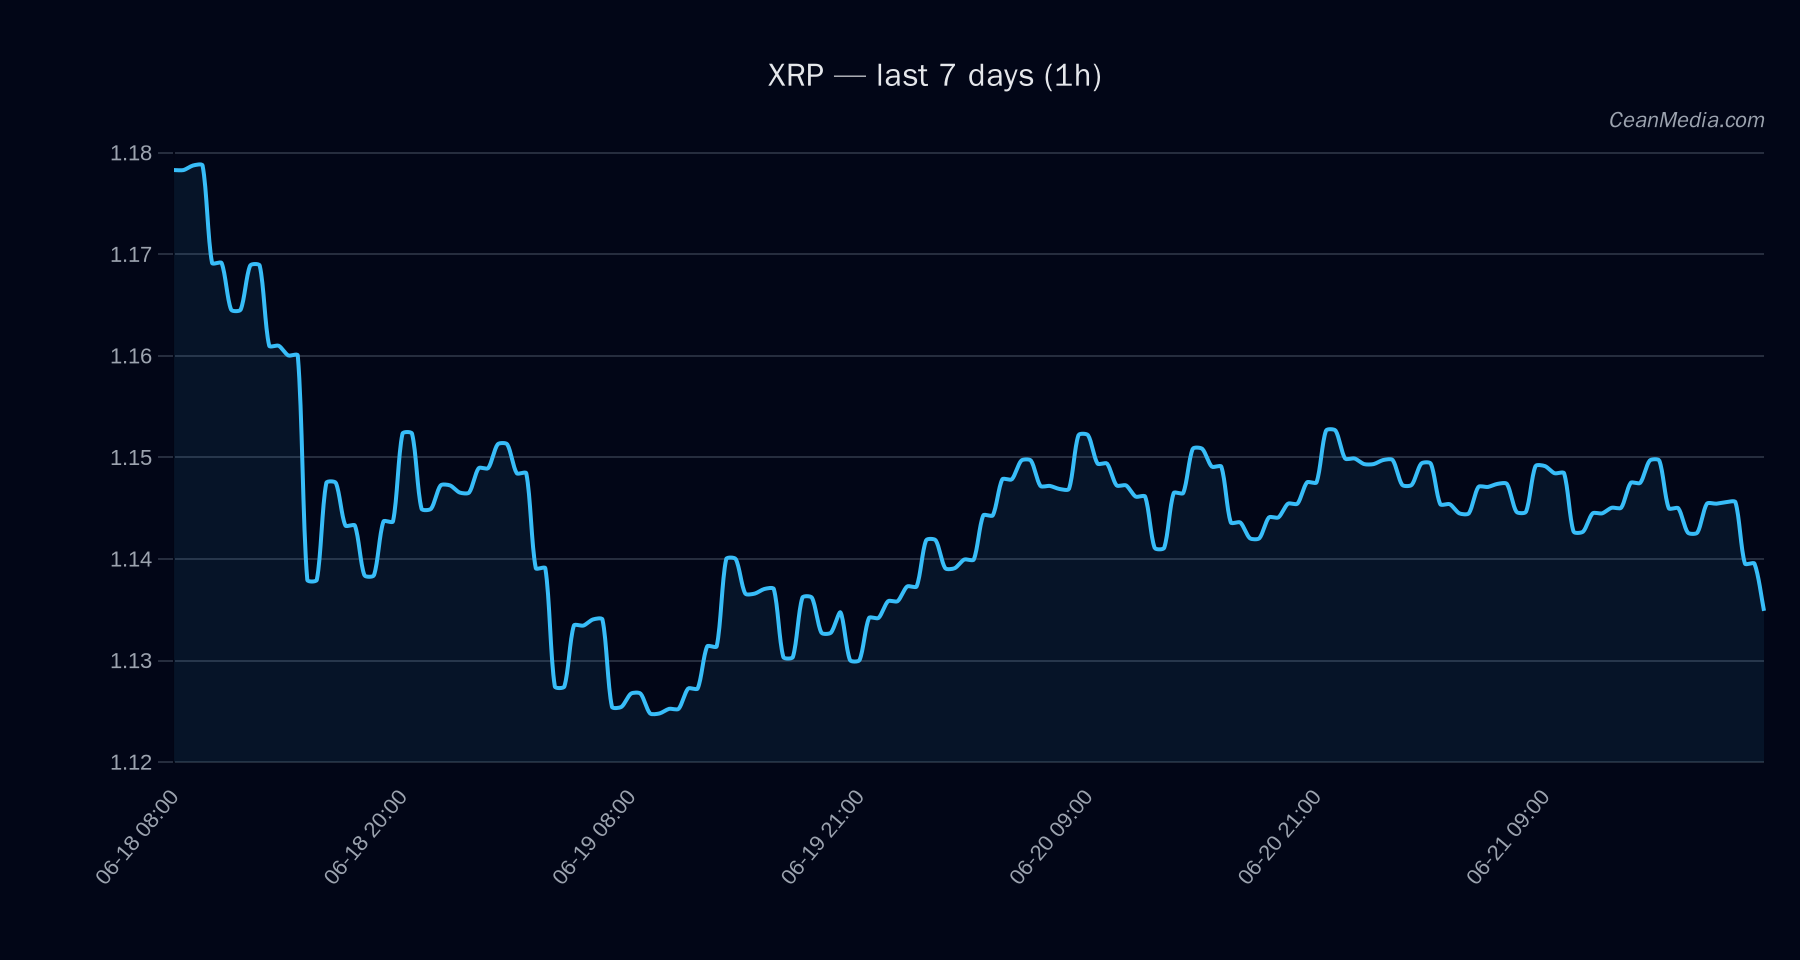
As of 2026-06-21, XRP sits in a confined trading range between support near 1.12 and resistance around 1.16. The current price is 1.1345. Market context shows very low volatility and a broad mix of signals, with a bearish TA trend and a model forecast leaning toward an upside move in the near term, though confidence remains low.
Technical Analysis: XRP
- Bias: mixed with bearish pressure; certainty low (13/100).
- Composite score: -2.6 with conflicts noted.
- Recent price action: Close at 1.1345.
- Trend indicators: EMA12 < EMA26, SMA50 < SMA200, RSI at 36; volatility (σ24h) 0.27%; volume regime: Very low.
- RSI: Neutral positioned near oversold territory.
- Forecast: Model indicates 55% probability of the price moving up in the next 24 hours; 34% probability of moving down; 11% sideways.
- Key levels:
- Support: 1.12 (near), major 1.10
- Resistance: 1.16 (near), major 1.22
- Triggers:
- Upscenario: 1h close > 1.16 targets 1.1803 / 1.2035
- Downscenario: 1h close < 1.12 targets 1.0896 / 1.0673
Drivers
- Return 24h: small negative move (-0.01%)
- EMA slope: marginal negative drift (-0.0013)
- Funding Z-score: positive signal (0.62)
- Basis Z-score: negative signal (-0.39)
- Order-book imbalance (EMA5): slight positive (0.05)
- BTC return 24h: small negative (-0.0032)
Overall momentum and volatility are subdued, with cross-market factors providing modest support through risk assets but not delivering a clear XRP-specific breakout signal. The broader trend indicators remain bearish, aligning with the current price context.
ETF Flows (BTC/ETH)
ETF flow data covers BTC and ETH and serves as macro risk context rather than a primary XRP signal. Current readings show:
- BTC ETF: -$90.7M (1D), -$141.6M (5D), +$83.0M (10D)
- ETH ETF: -$12.8M (1D), -$14.9M (5D), +$76.4M (10D)
Interpretation: Net outflows in BTC across the near term suggest cautious sentiment and potential risk-off pressure, while ETH displays a similar pattern but with modest 10D inflows. This ETF data is contextual and not a primary signal for XRP; it should be considered alongside XRP-specific indicators to gauge risk appetite and macro flows affecting correlated assets.
What to Watch Next
- Monitor for a close above the 1.16 resistance to confirm a near-term upside breakout toward 1.1803–1.2035.
- Watch for a break below 1.12 to validate a downside move toward 1.0896–1.0673.
- Assess changes in volatility regime and RSI movement for potential divergence from price action.
- Keep an eye on BTC/ETH ETF flow shifts as a broader risk-on/off backdrop that can influence XRP indirectly.
Hashtags: #XRP #CryptoAnalysis #TechnicalAnalysis #MarketSnapshot #ETFFlows #BTC #ETH #MacroContext #Liquidity #LiquidityRisk #PriceAction