Market Snapshot
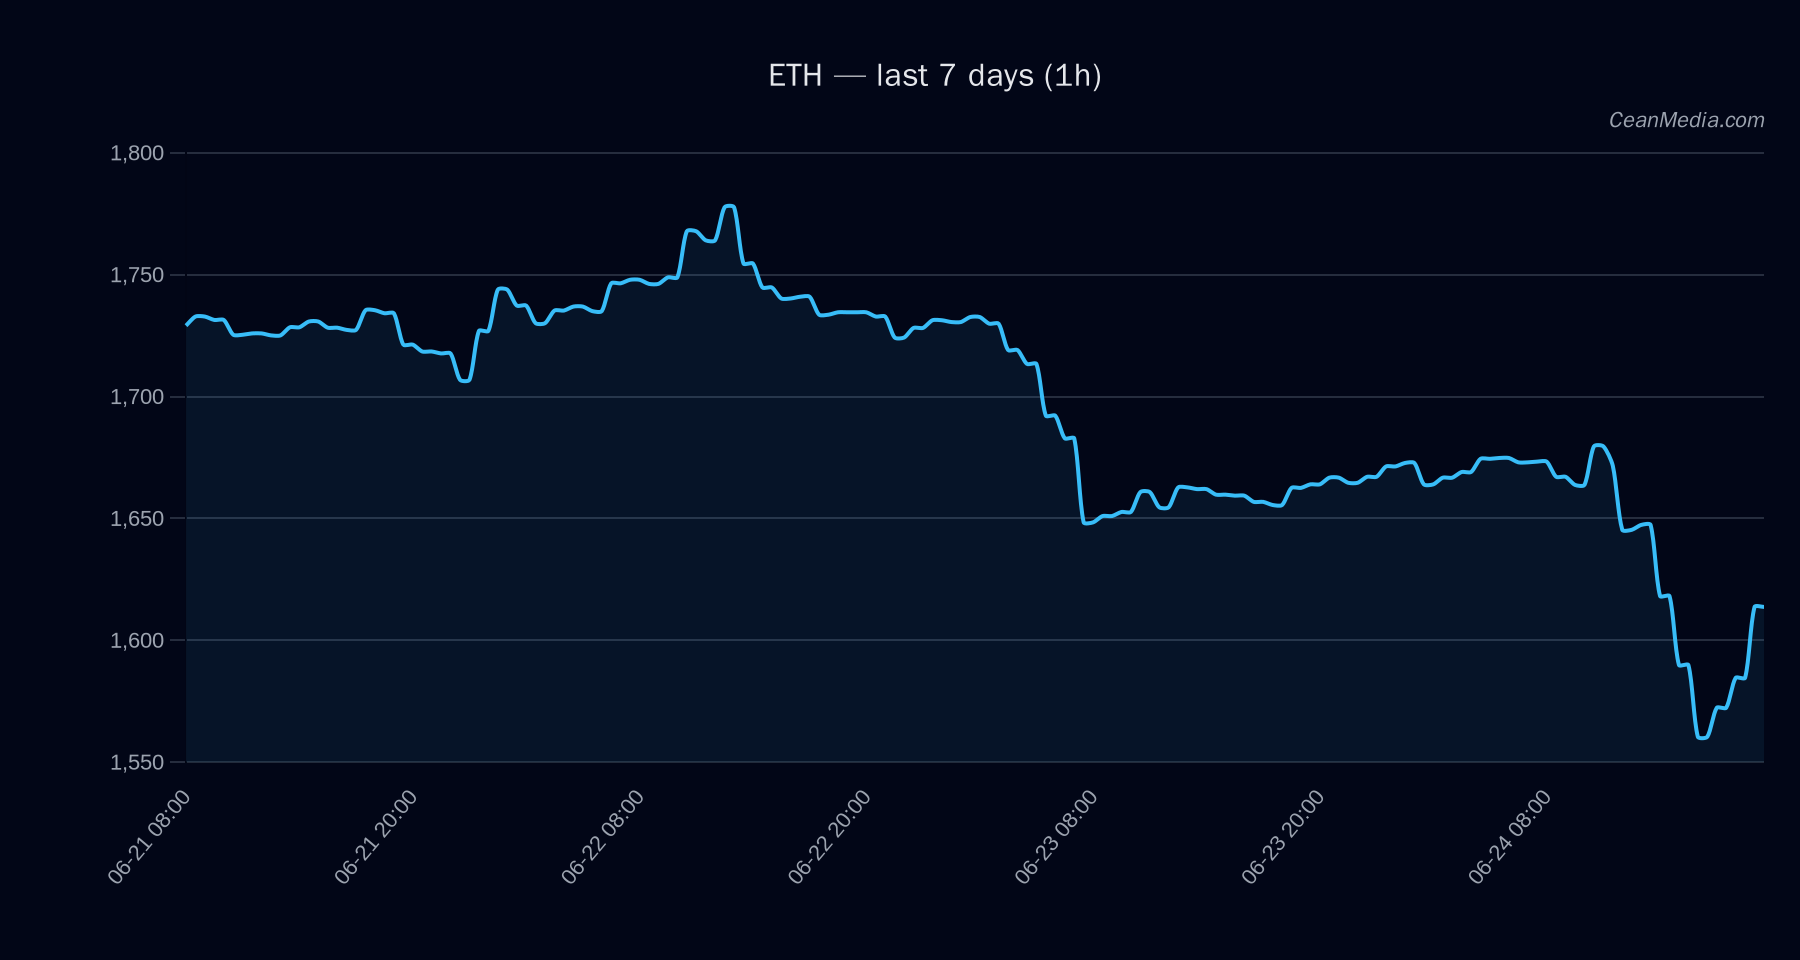
As of 2026-06-24, ETH sits in a narrow range with near-term support at 1,586 and resistance around 1,650. The composite view is bearish with a high certainty signal, and the forecast is sideways with a small probability of breakout in either direction. Market breadth is weak, and volatility is very low.
Technical Analysis: ETH
: EMA12 < EMA26, SMA50 < SMA200, low 24h volatility (σ24h 0.90%), very low vol regime : sideways (5%), Up 46%, Sideways 5%, Down 49% : P50 1,632.37; P20-P80 1,427.19 – 1,746.51
Drivers
include SP500 1D return, Z-score metrics (basis and funding), BTC dominance, and stock basket performance. Current readings indicate mixed momentum with a tilt toward downside pressure from macro factors. : Very low volatility regime; vol-of-vol is subdued; breadth below SMA50 suggests limited upside energy. : Cross-market risk assets softer; stablecoin liquidity contracting; sentiment showing extreme fear (F&G 17).
ETF Flows (BTC/ETH)
ETF flow data shown here is limited to BTC and ETH and is provided as context only; it should not be treated as a primary signal for ETH pricing. Current data indicates net outflows in BTC and ETH ETFs over 1D/5D/10D windows, suggesting a cautious risk-off backdrop that may influence broad-market sentiment but does not determine ETH-specific trajectory.
1D: -$113.8M; 5D: -$344.8M; 10D: -$637.5M 1D: -$82.4M; 5D: -$181.0M; 10D: -$255.7M
What to Watch Next
- Close consideration of a break above 1,650 to validate a potential upside extension toward 1,683.98–1,717.00.
- Watch for a close below 1,586 to confirm downward dispersion toward 1,554.49–1,522.77.
- Monitor changes in macro risk appetite and cross-asset correlations, particularly SPX and BTC dynamics, for signs of regime shift.
- Track volatility regime and order-book signals for any narrowing or expansion that could precede a breakout.
Hashtags: #ETH #Ethereum #CryptoMarkets #TechnicalAnalysis #ETFFlows #BTC #MarketSnapshot #TradingStrategy #RiskManagement #PriceAction #PriceLevels