Market Snapshot
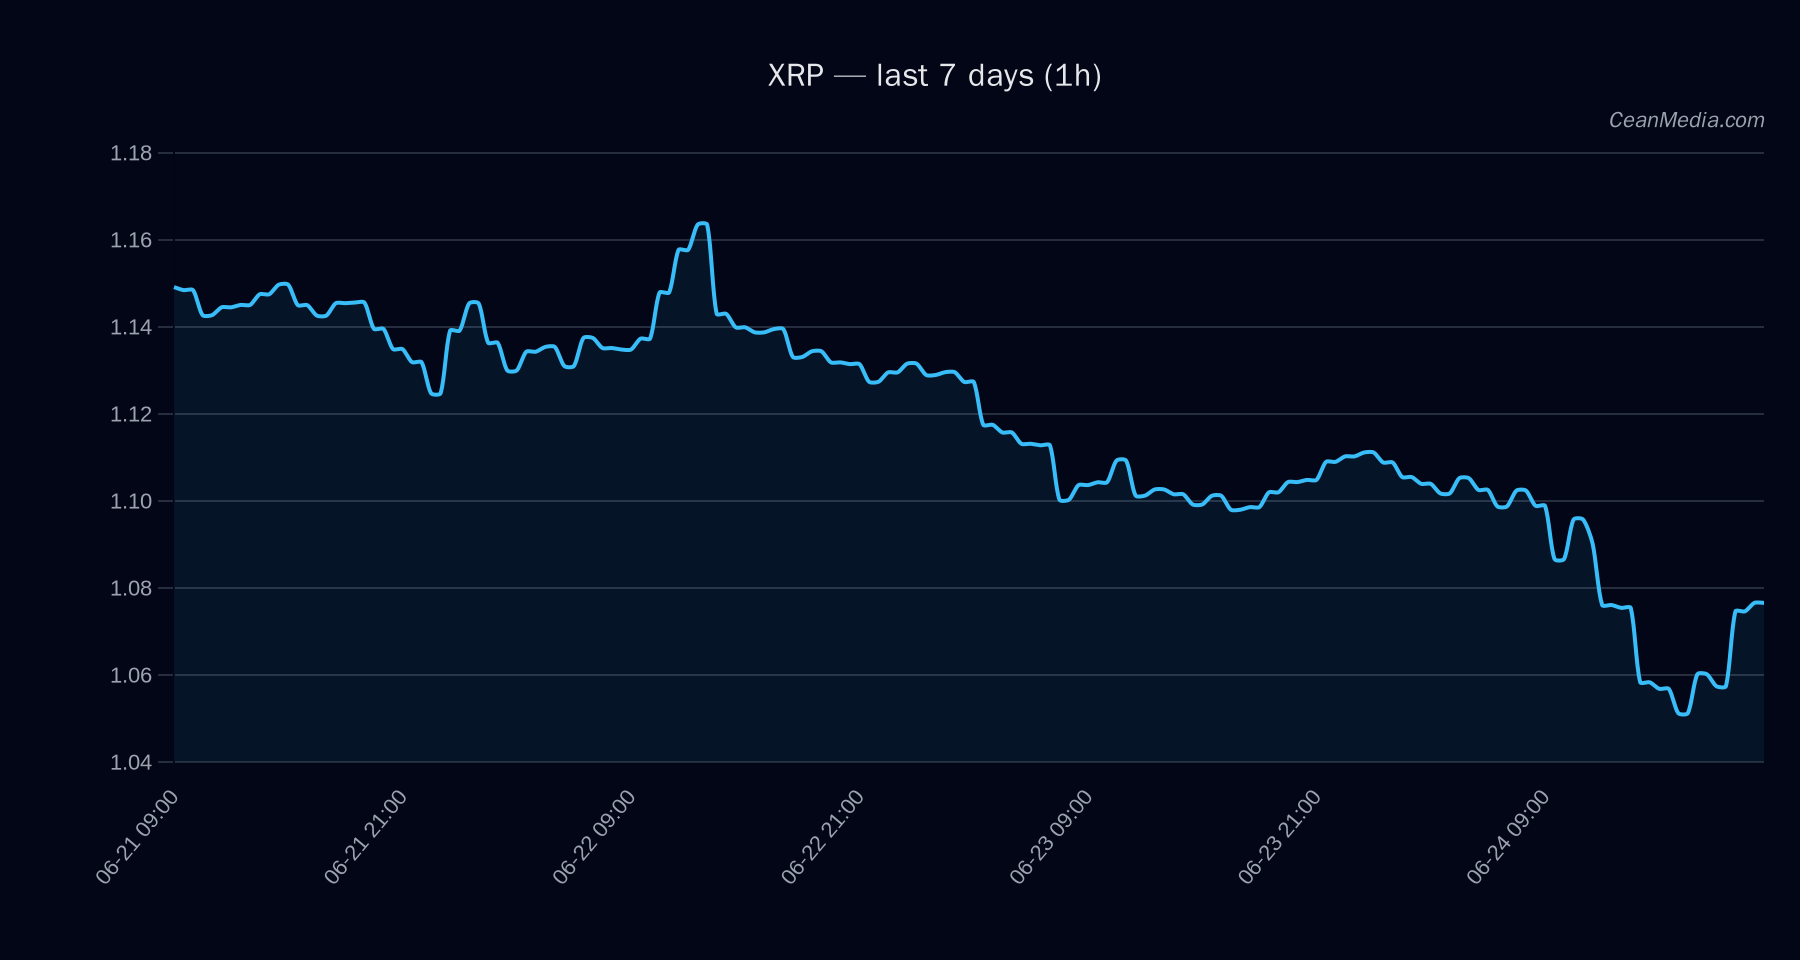
As of 2026-06-24, XRP is trading around 1.0751 with a price forecast leaning to an upside direction in the near term but mixed signals from technical and macro indicators. Market breadth is currently weak, and volatility remains very low, contributing to a cautious posture for tactical decisions.
Technical Analysis: XRP
- Mixed / bearish pressure with low certainty (31/100).
- -4.7 with 3 conflicting signals.
- Close at 1.0751.
- Up 54% (range to 1.0816 P50, 1.0–1.2183 P20-P80).
- Bearish (EMA12
- Support near 1.06 (major 1.1); Resistance near 1.1 (major 1.18).
- Upside: 1h close > 1.1 targets 1.1185–1.1405; Downside: 1h close < 1.06 targets 1.0325–1.0115.
- Breaks beyond major levels to confirm a new trend direction would be required; current inside-range condition (no breakout confirmation).
Contextual read indicates breadth at 0% above SMA50, BTC correlation at 0.87, and very low vol with a Fear/Greed index showing extreme fear. The current price sits between the identified support and resistance bands, suggesting a cautious stance until a breakout or breakdown confirms a directional move.
Drivers
- SPREAD BP (+1.92), DEPTH USD 10BP LOG1P (+1.09), NASDAQ/5D signals (-1.08), FNG VALUE (-1.03), GOLD/SILVER ratio Z-score (-1.33).
- RSI 43, very low volatility, 24h σ 0.67%, vol regime: very low; BTC correlation strong (0.87) with cross-asset softness noted.
- Cross-market risk assets softened; stablecoin liquidity contracting marginally; sentiment indicates extreme fear.
Forecast model assigns a 54% probability to upside for XRP over a 24-hour horizon, with downside risk at 38% and a sideways probability of ~8%. The divergence among model components warrants cautious positioning until a clear trigger confirms direction.
ETF Flows (BTC/ETH)
ETF flow data provided covers BTC and ETH and should be interpreted as context rather than a primary signal for XRP. The latest figures show negative ETF inflows for both BTC and ETH over 1D, 5D, and 10D horizons, indicating net outflows and a risk-off sentiment in broader crypto markets. This backdrop can contribute to liquidity constraints and risk-off pressure across tokens, including XRP, but is not a direct signal for XRP’s price action.
- 1D -$113.8M; 5D -$344.8M; 10D -$637.5M.
- 1D -$82.4M; 5D -$181.0M; 10D -$255.7M.
Investors should treat these figures as macro contextual signals rather than XRP-specific indicators. The XRP outlook remains primarily driven by asset-specific technicals and internal market dynamics.
What to Watch Next
- Watch for a close above 1.10 on any 1-hour candle to confirm upside progression toward 1.1185–1.1405.
- Monitor for a close below 1.06 on a 1-hour horizon to signal potential move toward 1.0325–1.0115.
- Observe shifts in market breadth and BTC/ETH ETF flows for signs of a broader liquidity push or risk-off reversal.
- Keep an eye on cross-market risk assets performance and stablecoin liquidity, as these macro factors can influence XRP’s volatility regime.
Hashtags: #crypto #XRP #trading #technicalanalysis #ETFflows #BTC #ETH #marketanalysis #riskmanagement #liquidity #volatility #priceaction