
Market Snapshot
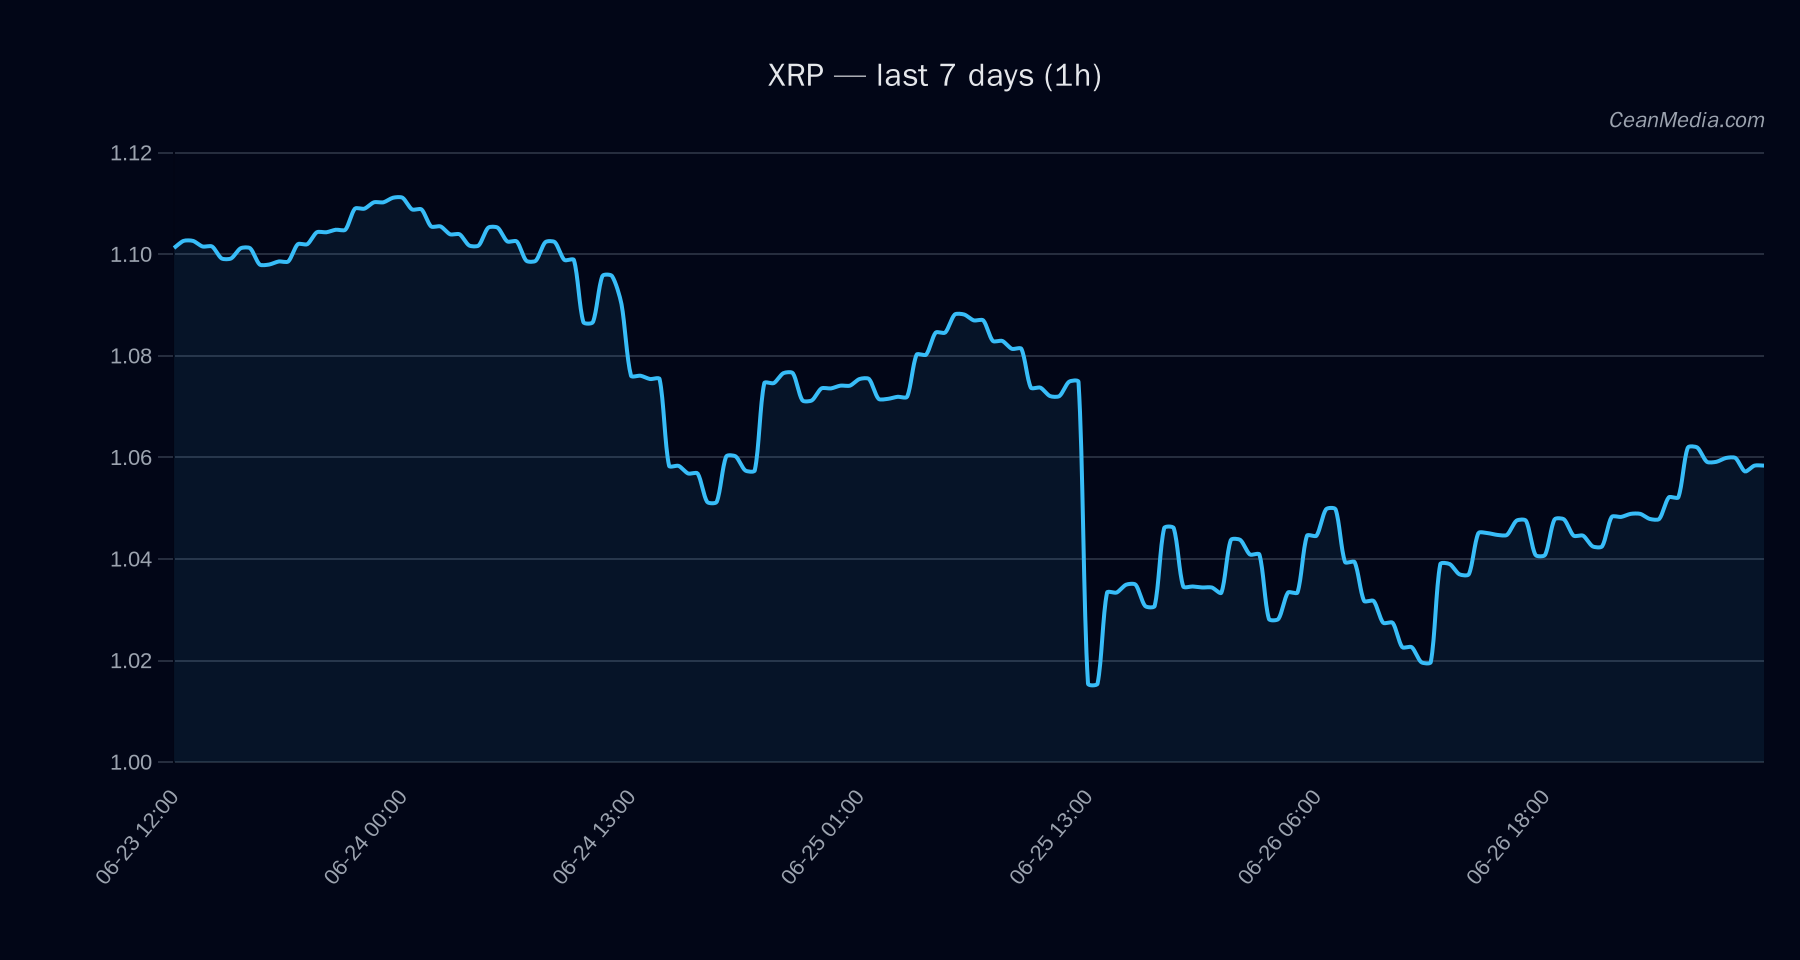
On 2026-06-27, XRP trades around 1.0574 with a mixed to bearish bias and low conviction (35/100). Market breadth remains supportive (>50h at 83%), while BTC correlation stands high (ρ(BTC,72h) ≈ 0.90). Overall, participants should monitor intraday levels and trigger-based exits as liquidity remains very low.
Technical Analysis: XRP
Mixed-to-bearish with a sideways to bearish tilt. Price sits between key levels: support near 1.04 (major 1.06) and resistance near 1.08 (major 1.16). 1.0574 P50 1.0283; P20–P80 0.9609–1.1988. Forecast direction: Down with 63% probability; Up 29%, Sideways 8%. - Up: Close > 1.08 → potential targets 1.1001 and 1.1217.
- Down: Close < 1.04 → potential targets 1.0155 and 0.9948.
Evidence is not fully aligned; traders should await trigger confirmation before treating direction as high-conviction. Support near 1.04; major support at 1.06. Resistance near 1.08; major resistance at 1.16.
Drivers
GOLD/Silver ratio Z-score (1.16), LIQ IMB Z-SCORE (12.66), DEPTH USD 10BP LOG1P (-2.16), BTC-related signals (BTC 24h return 0.01, BTC vol regime normalizing), and trend strength metric (0.83). Overall momentum modest with a tilt toward downside per the model forecast; volatility is very low, which can compress tradable ranges but also limit breakout reliability. Cross-market risk assets are soft; sentiment shows extreme fear; stablecoin liquidity is contracting over a 7-day window. Breadth remains strong, suggesting local participation but not a directional breakout.
ETF Flows (BTC/ETH)
Contextual note: ETF flow data shown here pertains to BTC and ETH only. This information is provided for macro context and is not a primary signal for XRP trading decisions. Several BTC/ETH ETF flows indicate recent demand shifts that can influence overall risk sentiment during periods of market stress or liquidity shifts.
1D: -$444.5M; 5D: -$1.19B; 10D: -$1.26B 1D: -$12.8M; 5D: -$204.4M; 10D: -$222.4M
The data suggests net outflows from BTC/ETH ETFs over multiple horizons, which may reflect risk-off behavior or reallocation among larger assets. While informative about broader market liquidity and risk appetite, XRP-specific signals require direct price action and microstructure cues rather than ETF flow alone.
What to Watch Next
- Watch for a daily close above 1.08 to validate the bullish trigger toward 1.1001–1.1217.
- Monitor for a daily close below 1.04 to validate the downside path toward 1.0155–0.9948.
- Monitor intraday liquidity and order-book dynamics given very low volatility and crowded long positioning signals.
- Remain aware of broader market risk-off signals as BTC/ETH ETF flows suggest ongoing risk-off sentiment that could impact XRP indirectly.
Hashtags: #XRP #CryptoMarkets #TechnicalAnalysis #CryptoTrading #BTCETFFlows #ETHETFFlows #MarketSnapshot #RiskOnOff #Liquidity #AltcoinAnalysis