Market Snapshot
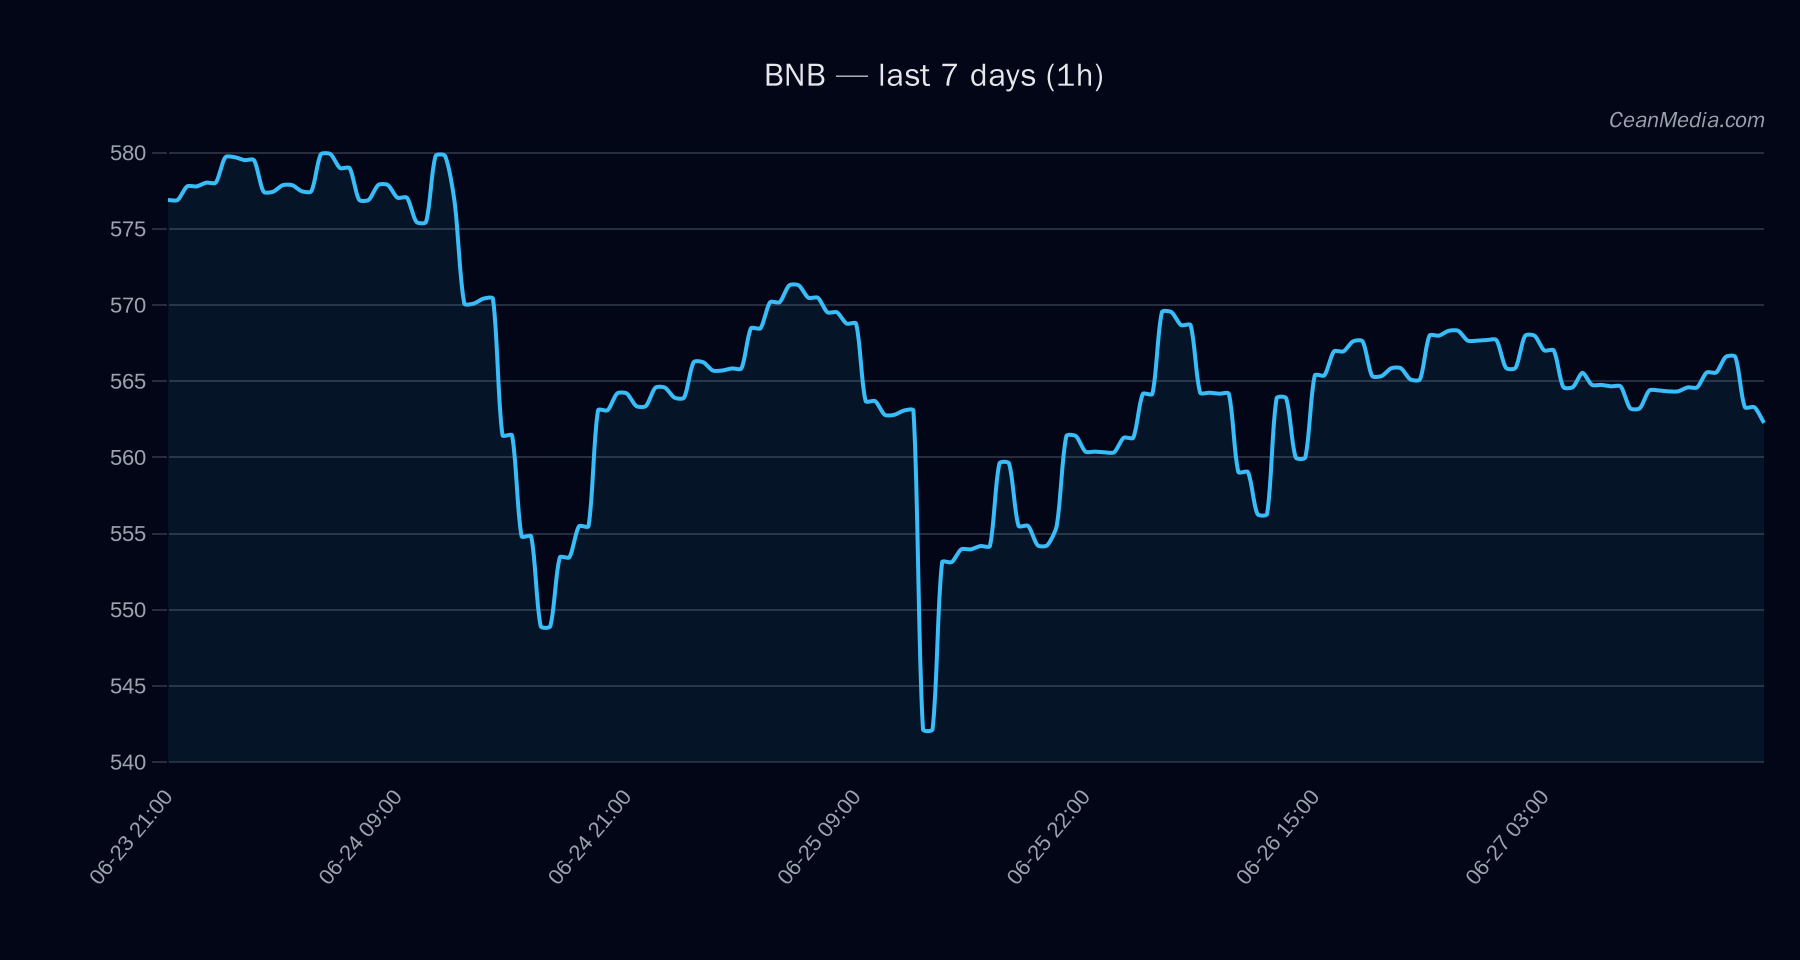
As of 2026-06-27, BNB trades near the 549 support and 571 resistance levels. The short-term bias is bearish with a medium certainty (55/100). The model indicates a sideways to mildly down drift with a P50 around 569.72 and a broad range of 522.64–578.83 for the next 24 hours. Market breadth is roughly neutral to modestly constructive (50% above the 50-day SMA), while BTC correlation remains high at 0.92 over 72 hours. Overall risk sentiment is characterized by extreme fear in the broader Fear & Greed index, and liquidity conditions in stablecoins show contraction. For risk management, traders should note the defined trigger levels below.
Technical Analysis: BNB
Bias & Certainty: Bearish with medium certainty (55/100).
Current Price: 560.14
Trend & Indicators:
- EMA12 < EMA26
- SMA50 < SMA200
- RSI: 40 (neutral)
- Volatility regime: Very low (σ24h: 0.28%)
Forecast & Range: Modeled as sideways (7% probability) with price range P20–P80 of 522.64–578.83 and P50 at 569.72 within the next 24 hours.
Levels
- Support: 549 (near), Major: 565
- Resistance: 571 (near), Major: 587
Triggers
- Up: 1h close > 571 → potential target 582.77–594.20
- Down: 1h close < 549 → potential target 537.96–526.98
Invalidation/Context: Breakouts beyond the specified major levels would alter the immediate risk posture; otherwise, the current range-bound view persists with a bearish TA configuration (RSI neutral).
Drivers
Top drivers from the model (contributions indicate relative impact):
- Return 24h: -0.01
- EMA slope: -0.0007
- Funding Z-score: +1.31
- Basis Z-score: +0.46
- Order-book imbalance (EMA5): -0.15
- BTC 24h return: +0.02
Market context: Very low volatility regime; BTC dominance ~55.85%; Stablecoin liquidity contracting; Sentiment: extreme fear. The top drivers suggest modest downside pressure from trend indicators, with limited offset from funding and BTC-related signals.
ETF Flows (BTC/ETH)
Contextual note: ETF flow data shown here pertains to BTC and ETH ETFs only. This information is provided for broader market context and should not be used as a primary signal for BNB positioning. The data indicate net outflows in BTC and ETH ETFs over recent windows, which can reflect risk-off sentiment or sector reallocation among large-cap crypto assets.
- BTC ETF: -$444.5M (1D), -$1.19B (5D), -$1.26B (10D)
- ETH ETF: -$12.8M (1D), -$204.4M (5D), -$222.4M (10D)
Implication: The BTC/ETH ETF flows point to a risk-off backdrop with broad capital reallocation away from top-tier crypto assets. While informative for market tone, these flows are not a direct signal for BNB and should be considered as auxiliary context in conjunction with asset-specific TA.
What to Watch Next
- Monitor 1h close above 571 for potential bullish extension toward 582.77–594.20.
- Watch for a break below 549 to confirm a downside move toward 537.96–526.98.
- Observe changes in EMA12/EMA26 slope and RSI direction for early trend signals.
- Correlate BNB movements with BTC dominance shifts and overall stablecoin liquidity signals as part of cross-asset context.
Hashtags: #BNB, #TechnicalAnalysis, #CryptoMarkets, #BTCETFFlows, #ETHETFFlows, #MarketSnapshot, #RiskOnOff, #TradingStrategy, #CryptoTA, #PriceAction