Market Snapshot
ADA sits near a key support at 0.14 with resistance around 0.145. The current bias on the asset is bearish with a medium certainty around 57/100. Forecast models indicate a downside tilt with a 59% probability for a down scenario over the near term. Market breadth is subdued and the 72-hour BTC correlation stands high at 0.80, underscoring a risk-off environment influencing liquidity and flows across related markets.
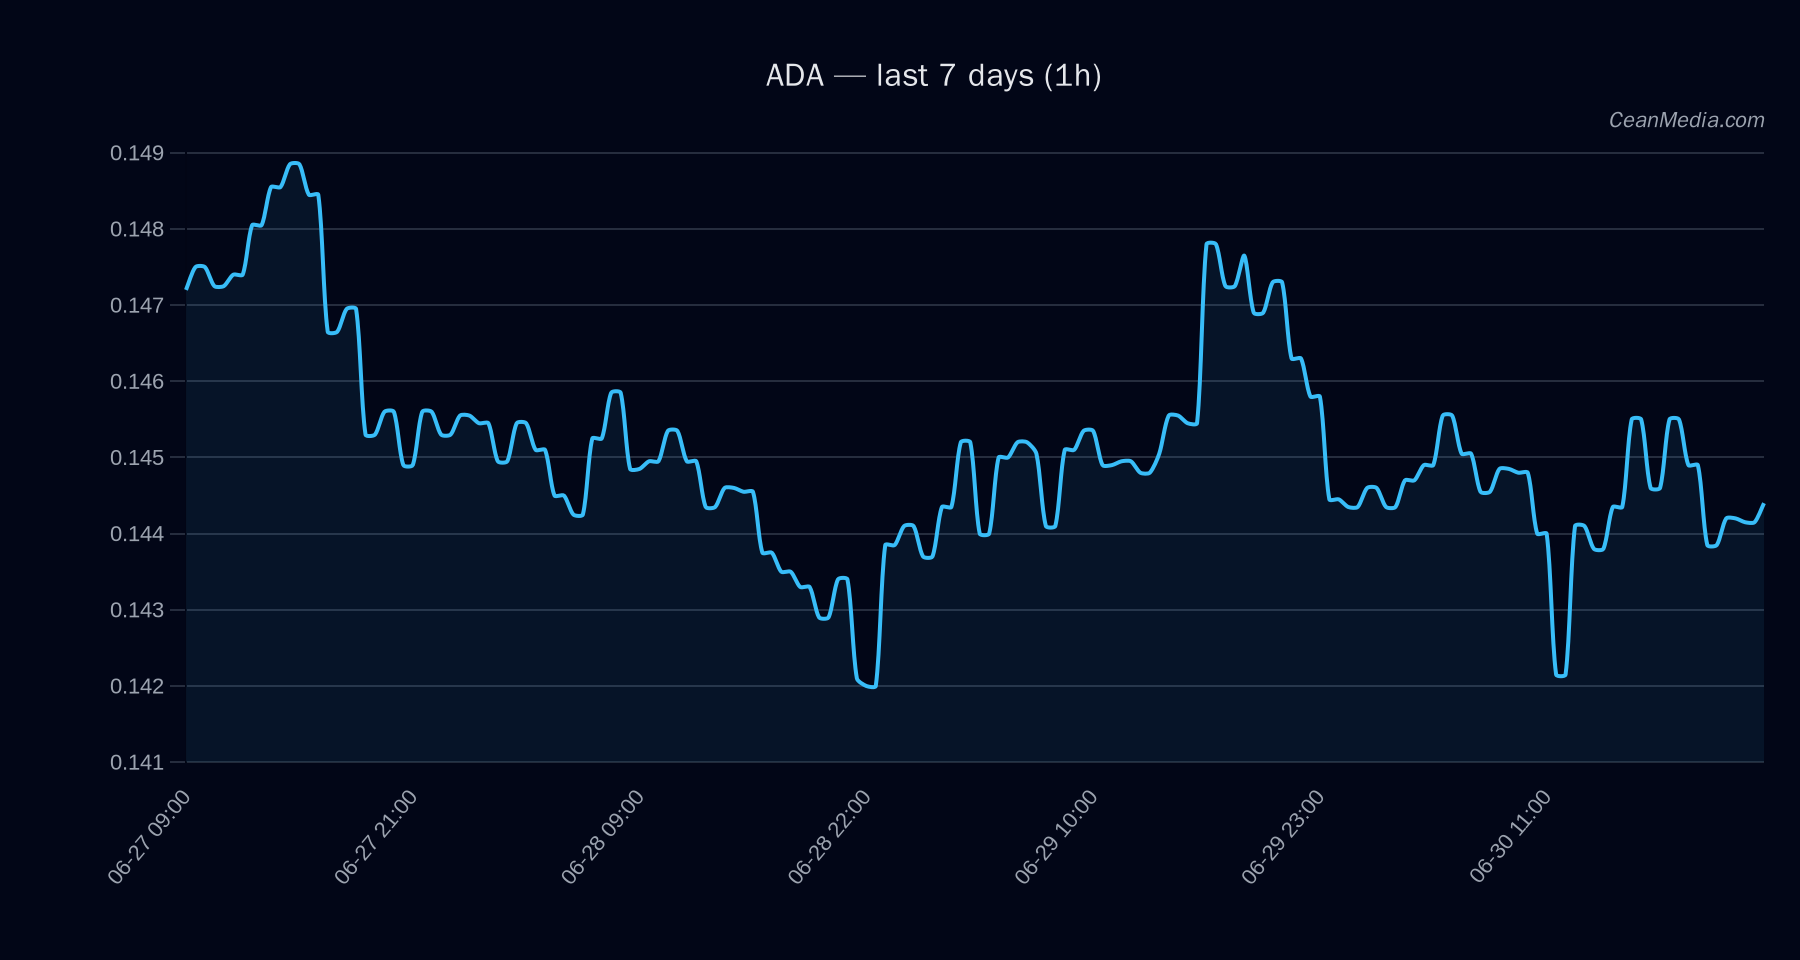
Technical Analysis: ADA
- Price (close): 0.144
- Trend: Bearish (RSI 46). EMA12 < EMA26; SMA50 < SMA200; very low intraday volatility (σ24h 0.56%).
- Forecast: Down (59% probability). Model forecast shows a down bias with a 59% likelihood of further downside; upside and sideways scenarios combined account for 41%.
- Key levels:
- Support near 0.14
- Major support at 0.145
- Resistance near 0.145
- Major resistance at 0.16
- Traders’ triggers:
- Up: Close > 0.145 within 1 hour → potential move toward 0.1498–0.1528
- Down: Close < 0.14 within 1 hour → potential move toward 0.1383–0.1355
- Invalidation/Notes: Evidence is not fully aligned; consider waiting for a trigger confirmation before treating direction as high-conviction.
Drivers
- LIQ IMB Z-SCORE: +3.46 (value 12.14)
- SPREAD BP: -3.18 (value 4.47)
- DEPTH USD 10BP LOG1P: -2.46 (value -3.66)
- FNG Z-SCORE: +1.7 (value 6.43)
- GOLD/SILVER RATIO Z-SCORE: +1.42 (value 0.96)
- BTC DOMINANCE: +1.4 (value -1.95)
- Momentum/Volatility Breadth is low (17% above SMA50). BTC-ADA 72h correlation is high at 0.80, indicating market-wide risk-off conditions may be impacting ADA pricing. Implied vol regime is very low, with ATR at 0.0008 and vol unit at 0.0012.
ETF Flows (BTC/ETH)
Context: ETF flow data is provided for BTC and ETH only and should be interpreted as market-wide liquidity signals rather than primary signals for ADA. Recent data show net outflows:
- BTC ETF: 1D -$231.0M; 5D -$1.33B; 10D -$1.47B
- ETH ETF: 1D -$29.9M; 5D -$221.5M; 10D -$236.4M
Interpretation: The ETF flows indicate a risk-off backdrop with liquidity moving away from BTC and ETH over multiple horizons. This context can contribute to broader weakness in correlated assets, but is not a primary signal for ADA. Use these signals to gauge macro liquidity conditions and potential spillover risk rather than as a stand-alone ADA trigger.
What to Watch Next
- Watch for a close above 0.145 within the next 1 hour to target 0.1498–0.1528, validating a potential near-term bounce against the dominant bearish bias.
- If ADA breaks below 0.14, monitor for momentum toward 0.1383–0.1355 and reassess risk exposure.
- Keep an eye on BTC/ETH ETF flow signals as a backdrop for liquidity shifts that could affect cross-asset correlations.
- Reassess on any change to breadth and volatility indicators; a broadening breadth or rising vol could alter the risk premium priced into ADA.
Hashtags: #ADA #ADAAnalysis #CryptoMarkets #TechnicalAnalysis #ETFFlows #BTC #ETH #MarketSnapshot #RiskOff #Liquidity #TradingStrategy