Market Snapshot
As of 2026-07-02, ADA is trading near key support and resistance levels with very low volatility. The composite view shows a mixed/neutral bias with low confidence. Broad market context points to risk-off tendencies in the broader crypto space, reinforced by ETF flow data for BTC and ETH rather than ADA-specific signals.
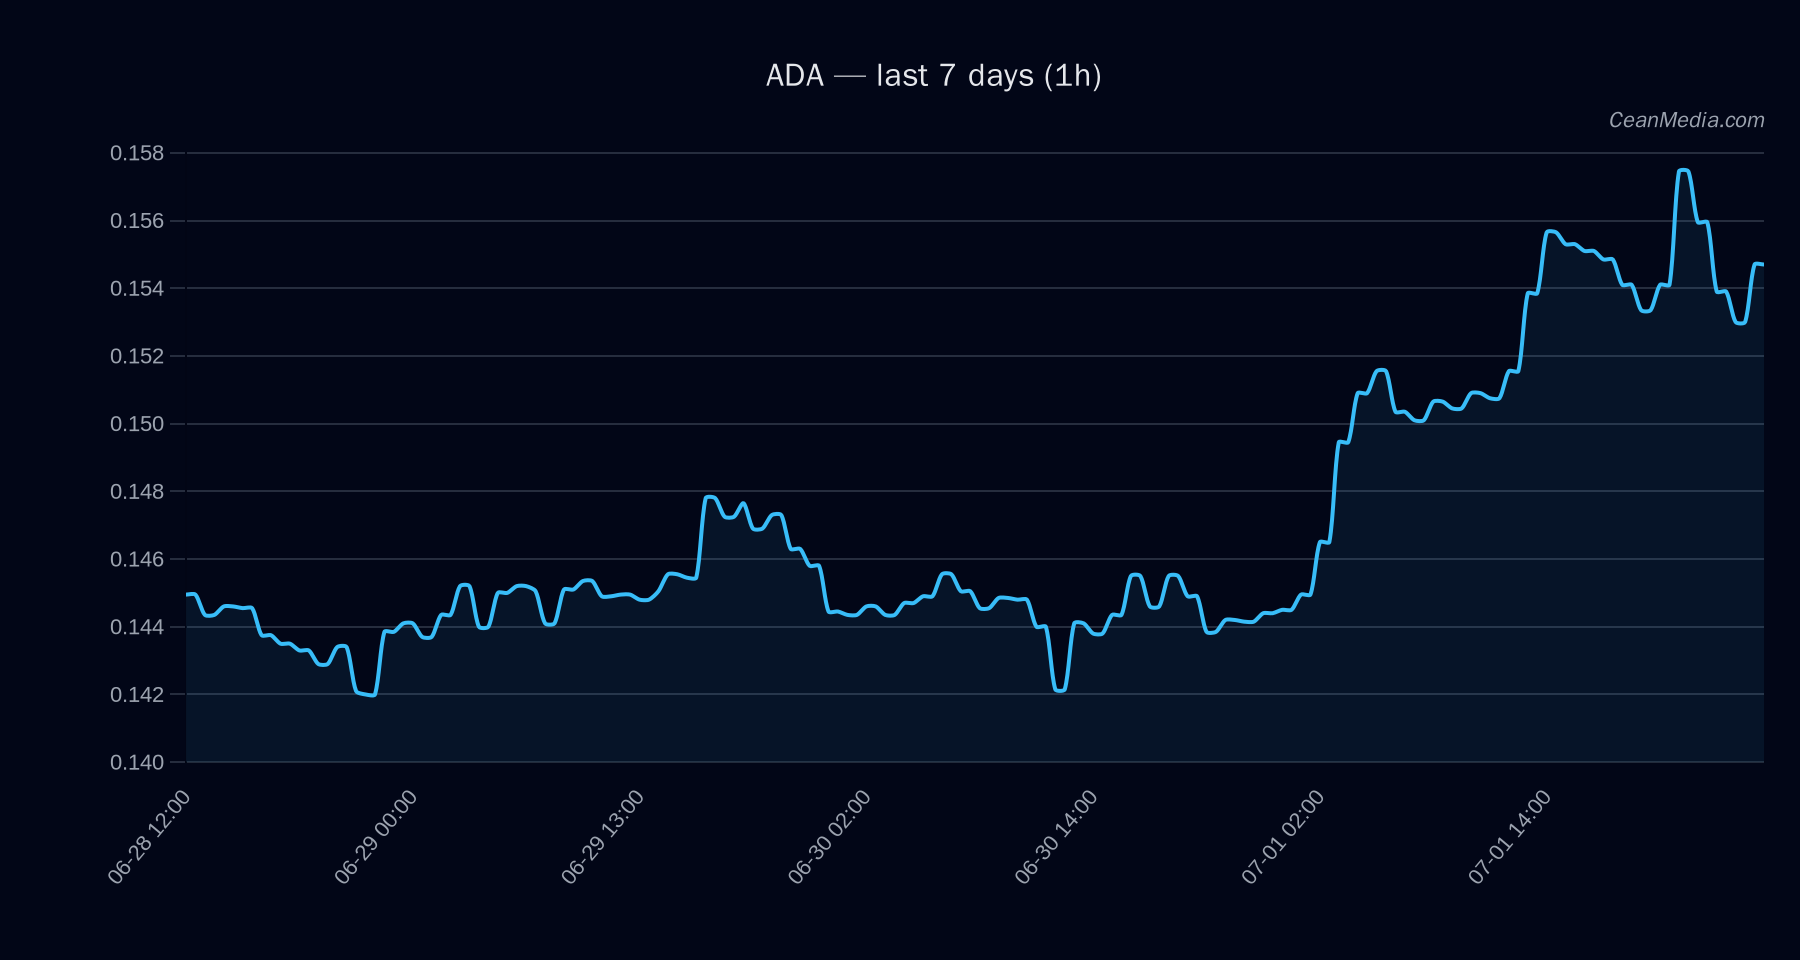
Technical Analysis: ADA
- Price: Close around 0.1544, with a forecast range suggesting potential moves between roughly 0.1413 and 0.1761 over the next 24 hours.
- Bias and Trend: Bias mixed/neutral; TA trend bullish (EMA12>EMA26, SMA50>SMA200, RSI 58). Vol regime described as very low with σ24h about 0.89%.
- Support & Resistance: Support near 0.15 (major 0.145); Resistance near 0.155 (major 0.175). Breaks above 0.155 imply targets at 0.1606–0.1638; breaks below 0.15 imply 0.1483–0.1453.
- Key Triggers: Up: close > 0.155; Down: close < 0.15.
- Invalidation/Context: Market context shows cross-market risk assets softening with extreme fear sentiment; data alignment warning noted in the narrative, indicating lower conviction in directional signals until trigger confirmations occur.
- Forecast: Down with probability ≈ 56.8% (horizon: 24h). Alternative probabilities: Up ≈ 34.5%, Sideways ≈ 8.6%.
Drivers
SPREAD BP, FNG Z-SCORE, LIQ IMB Z-SCORE, GOLD/SILVER RATIO Z-SCORE, BTC DOMINANCE, LS GLOBAL Z-SCORE. BTC 72h correlation ≈ 0.73; Alt breadth excluding mega coins at 100%; Vol regime is very low; funding and basis z-scores show mixed pressure signals. Overall model output leans toward a downside tilt in the near term, but TA indicators remain bullish on price structure, underscoring a nuanced, low-velocity environment.
ETF Flows (BTC/ETH)
Contextual market data shows ETF flows for BTC and ETH, not ADA. BTC ETFs reported -$231.0M for 1D, -$1.33B for 5D, and -$1.47B for 10D. ETH ETFs reported -$29.9M (1D), -$221.5M (5D), and -$236.4M (10D). These figures provide a risk-on/off backdrop for institutional liquidity in the broader crypto market but are not primary signals for ADA itself. Traders should treat ETF data as contextual rather than a direct ADA signal.
What to Watch Next
- Monitor 1h close relative to 0.155: a close above 0.155 would open the 0.1606–0.1638 range.
- If price breaks below 0.15, watch for a move toward 0.1483–0.1453.
- Observe changes in volatility regime and RSI movement around 58 to gauge whether the bullish TA momentum strengthens or eases.
- Track BTC/ETH ETF flow signals for shifts in risk appetite that could impact broad crypto correlations, while continuing to treat these as context rather than ADA-specific drivers.
Hashtags: #ADA #crypto #trading #technicalanalysis #ETFs #BTCFlows #ETHFlows #riskmanagement #marketanalysis #AAPL (example) #cryptoNews