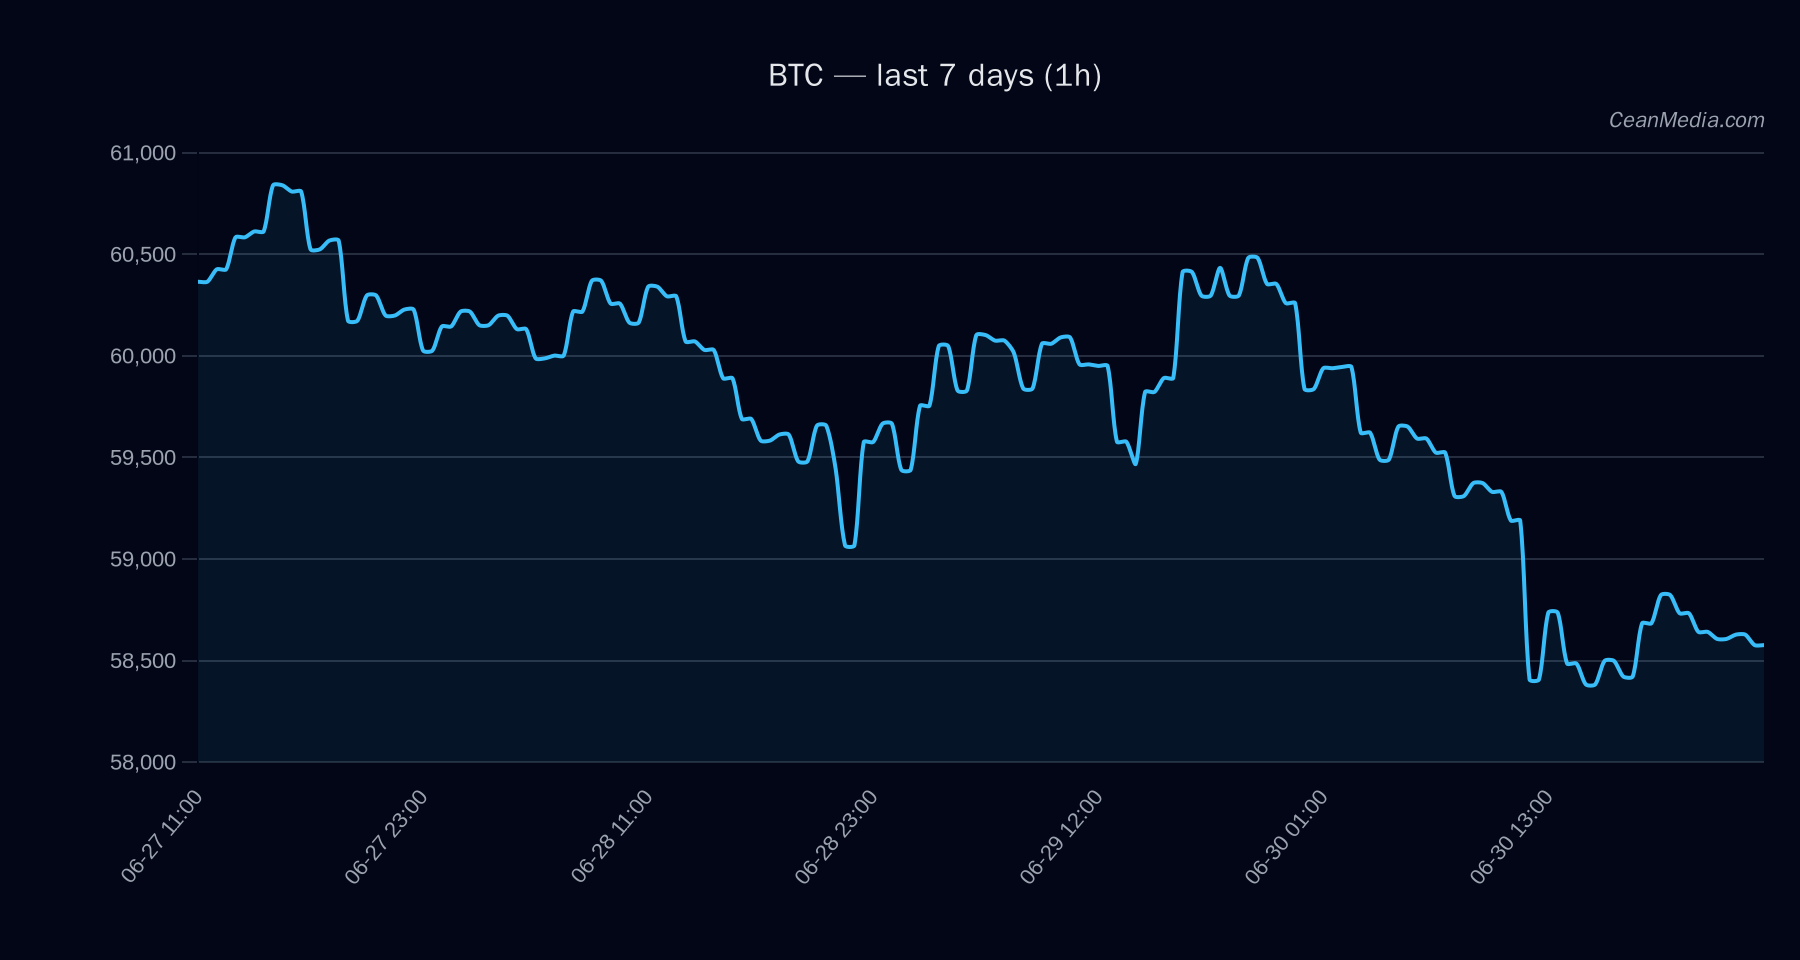
Market Snapshot
BTC trades with a bearish tilt as of the latest close at 58,780.26. The model shows a down bias with high certainty (90/100). Price action sits within a defined range, with near-term support at 57,600 and resistance at 59,950, and a broader major level near 61,600. Market context indicates very low volatility and extreme fear in sentiment measures, with breadth modestly positive relative to recent SMA baselines.
Technical Analysis: BTC
EMA12 < EMA26, SMA50 < SMA200, RSI 43 Support near 57,600; Major support/target near 59,600-59,950; Major resistance near 61,600
Traders should monitor the following triggers for confirmation:
1h close > 59,950 → potential move toward 61,154.98 and 62,354.10 1h close < 57,600 → potential move toward 56,452.56 and 55,300.47
Forecast range (next 24 hours): P20 52,780.86 – P80 60,985.13; P50 58,555.94. The probability-weighted view favors a Down direction (≈47.6%), with Upside around 35.2% and Sideways ≈17.1%.
Drivers
Stable MCAP log1p, Gold/Silver ratio, LS Top Z-score, Vol of Vol, Crypto Stock Basket Return, Depth Z-score Very low vol regime; price action showing modest downside momentum with RSI in oversold-like territory (41-43 zone historically associated with weak upside pressure) 17% above SMA50; BTC correlation with markets near 1.0 Cross-market risk assets softening; stablecoin liquidity contracting; sentiment Extreme Fear (F&G index 11)
ETF Flows (BTC/ETH)
Contextual note: ETF flow data included here represents BTC and ETH ETF movements and should be treated as contextual information rather than a primary signal for BTC price action. Net flows show persistent ETF outflows over multiple lookbacks: BTC ETF -$231M (1D), -$1.33B (5D), -$1.47B (10D); ETH ETF -$29.9M (1D), -$221.5M (5D), -$236.4M (10D).
Interpretation: Persistent BTC ETF outflows and broader crypto ETF drain can reflect risk-off sentiment and de-risking flows. This context aligns with a bearish bias for BTC in the near term, but ETF data is not a standalone signal and should be weighed with price action, liquidity conditions, and on-chain indicators.
What to Watch Next
- Watch for a 1-hour close above 59,950 to validate potential upside continuation toward 61,154.98 and 62,354.10.
- Monitor a break below 57,600 for confirmation of downside acceleration toward 56,452.56 and 55,300.47.
- Observe changes in volatility regime; a shift from Very low to higher volatility could alter the probability distribution of the forecast.
- Keep an eye on ETF flow momentum for BTC/ETH as an additional context; persistent outflows may reinforce risk-off sentiment.
Hashtags: #BTC #Bitcoin #MarketAnalysis #TechnicalAnalysis #ETFFlows #CryptoMarkets #Volatility #RSI #MA #PriceAction