Market Snapshot
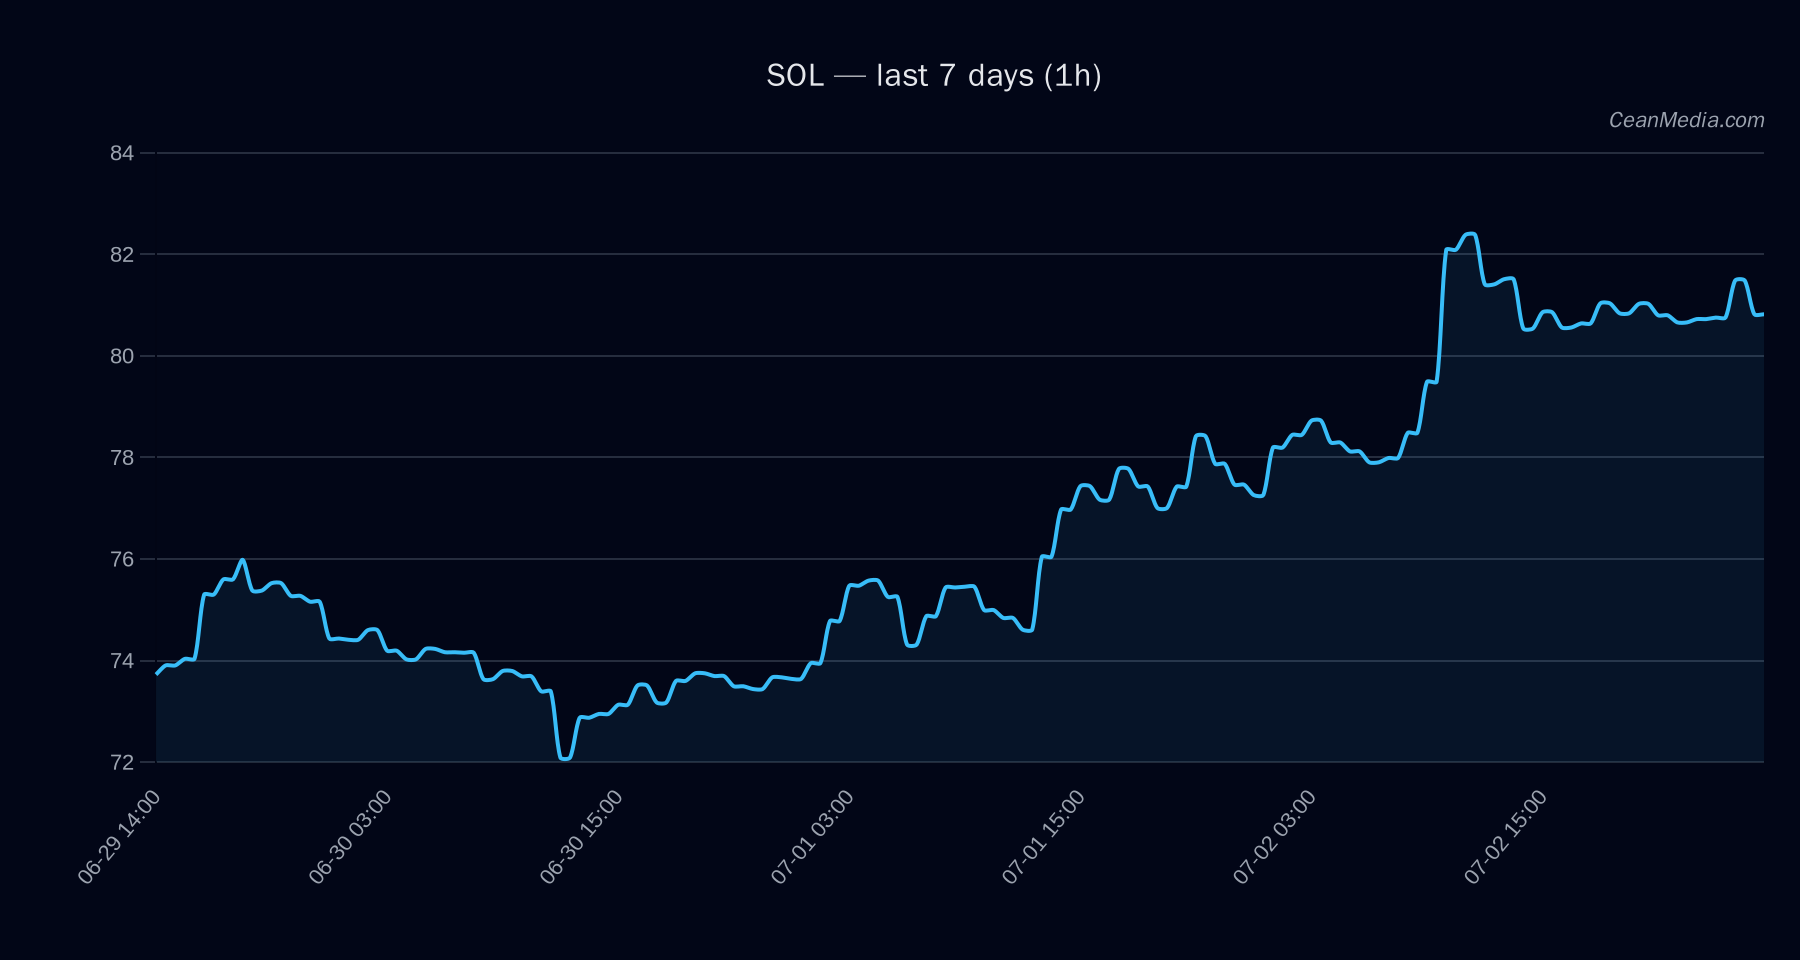
Solana (SOL) sits in a tight trading band with near-term bullish bias but low conviction. The price closed at 80.66, trading within a range bounded by key support near 79 and resistance near 82.3. Overall market breadth remains strong above the 50-day simple moving average, and cross-asset risk appetite provides a supportive backdrop, though macro sentiment indicators show pockets of caution (extreme fear in broader market sentiment).
Technical Analysis: SOL
Bias and Range
Bias: slightly bullish | certainty low (25/100). Forecast range suggests upside potential with a P50 around 80.20 and a wide P20–P80 spread of 72.58–93.85. Price targets lean toward the upper end of the range on breakout signals.
Price and Model Signals
Close: 80.66
Model forecast: Up (49%), with Up probability higher than Down (42%) and Sideways (9%).
Technical Trend
Trend: bullish (EMA12>EMA26, SMA50>SMA200, RSI 57). Implied volatility (σ24h) 0.88% with a very low volatility regime. RSI sits in a neutral zone, indicating room to move before overbought conditions emerge.
Key Levels
Support near 79; major support at 75.8. Resistance near 82.3; major resistance at 75.6 (note: major levels indicate critical thresholds). Break above 82.3 opens a path toward 83.92–85.56. Break below 79 targets 77.47–75.88.
Triggers
Up: 1h close > 82.3 to target 83.92–85.56. Down: 1h close < 79 to target 77.47–75.88.
Invalidation / Confidence
Context indicates no breakout confirmation at present; within-range dynamics and CA-level inputs suggest awaiting a trigger for directional confirmation.
Momentum and Context
Breadth: 100% above SMA50. BTC correlation (72h): 0.71, indicating a positive, but not dominant, influence from BTC. Alt breadth ex-mega: 100%. ETF views are cumulative signals rather than primary SOL drivers in this analysis.
Drivers
- Top drivers include 24h return, EMA slope, and various Z-score signals (LS GLOBAL, LS TOP, FNG, DEPTH). These collectively contribute to a mildly bullish stance with limited conviction due to volatility and external risk factors.
- BTC 24h return: +1.68% (approximate read from model inputs). BTC dominance near 55.6% with a 24h delta of +0.02 helps explain risk-on tone for liquidity-driven assets.
- Vol regime: Very low; vol-of-vol and distance-from-ma indicators support a range-bound environment with potential breakout triggers.
ETF Flows (BTC/ETH)
Contextual note: ETF flow data provided here relate to BTC and ETH ETFs and are not a direct signal for SOL. They serve as market-wide liquidity and risk-appetite context that can influence the broader crypto environment.
- BTC ETF flows: 1D -$231.0M, 5D -$1.33B, 10D -$1.47B (net negative).
- ETH ETF flows: 1D -$29.9M, 5D -$221.5M, 10D -$236.4M (net negative).
Interpretation: The ETF data indicate risk-off or liquidity-draining pressure in BTC/ETH over short horizons, which can coincide with liquidity considerations for the crypto space. However, these figures are not primary signals for SOL and should be considered as context for overall market risk sentiment.
What to Watch Next
- Watch for a close above 82.3 on an intraday or 1-hour basis to validate the upside trigger toward 83.92–85.56.
- Monitor a break below 79 for potential move toward 77.47–75.88; manage risk accordingly if price breaks support.
- Keep an eye on BTC/USD strength and BTC dominance dynamics, as a sustained shift could recalibrate cross-asset risk appetite affecting SOL.
- Stay aware of volatility regime changes, particularly if volatility ticks higher or if market breadth begins to diverge from price action.
Hashtags: #SOL #Solana #CryptoAnalysis #TechnicalAnalysis #ETFFlows #BTC #ETH #MarketSnapshot #CryptoMarkets #TradingStrategy #Liquidity