Market Snapshot
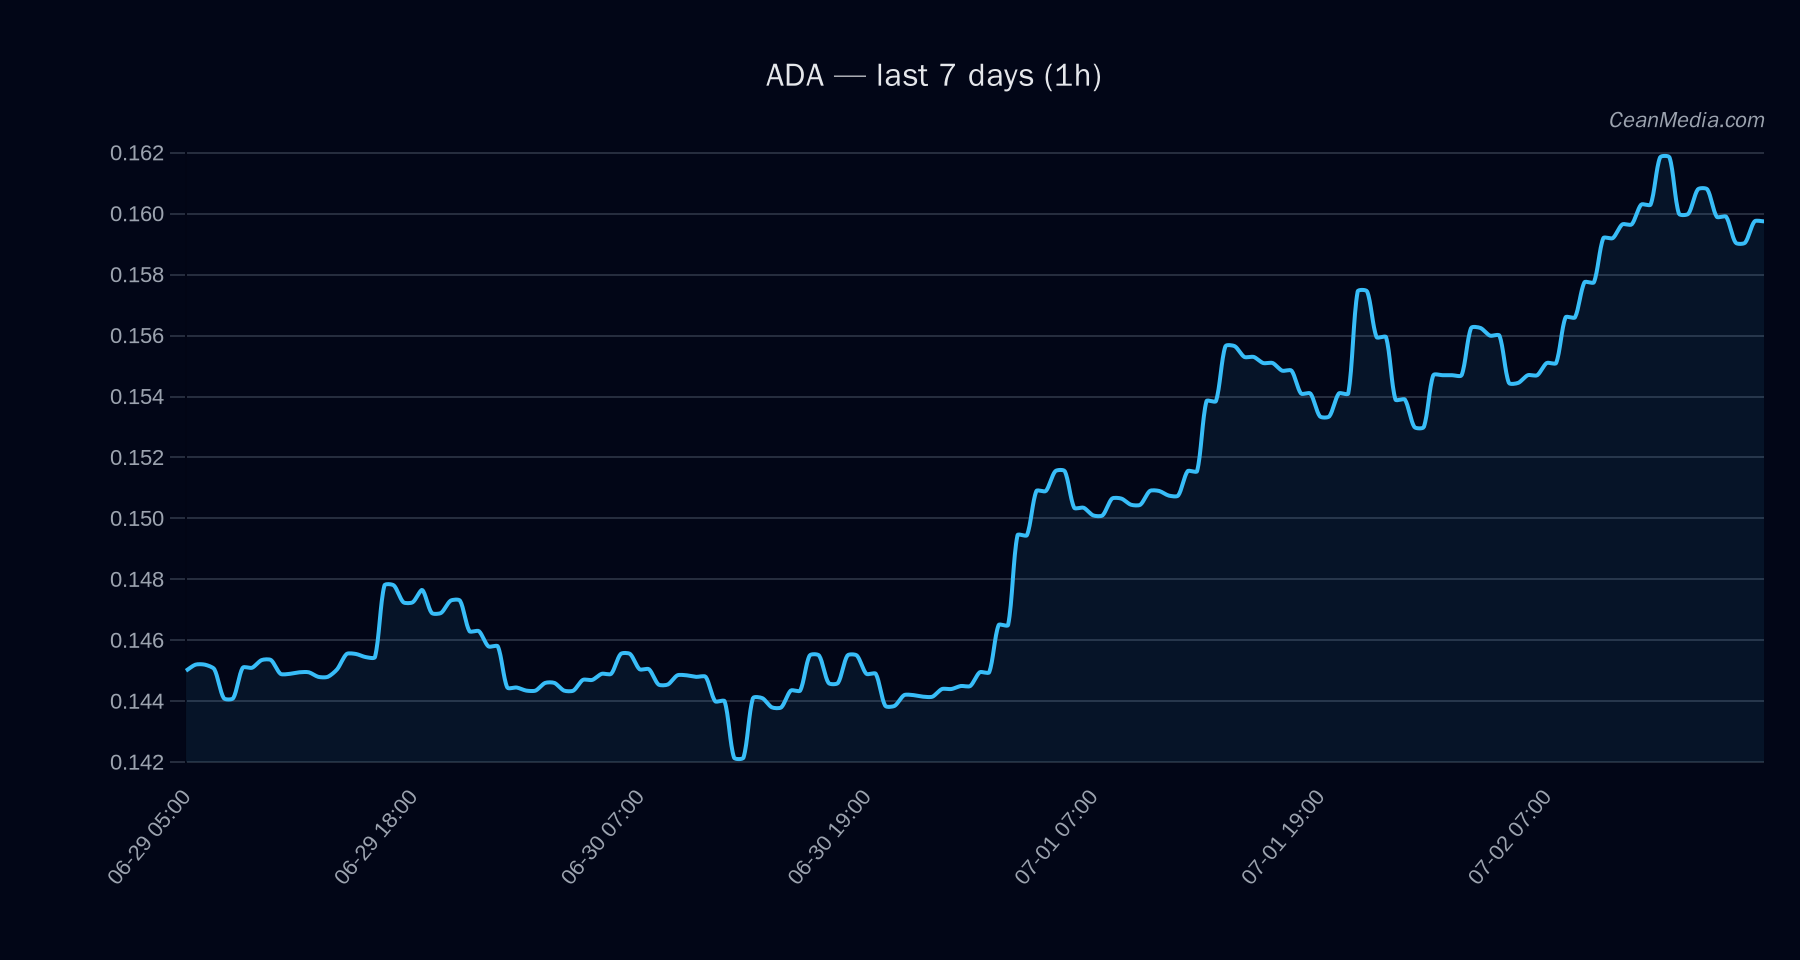
On 2026-07-02, Cardano (ADA) traded around 0.1592 with a very low volatility regime. Market breadth remained strong above the 50-period SMA, and BTC correlation stood at 0.71 over 72 hours, indicating ongoing positive cross-asset alignment in the near term. Overall sentiment indicators show extreme fear (F&G 19), while single-session momentum remains modest.
Technical Analysis: ADA
- Bias: Mixed / Neutral; certainty low (5/100)
- Composite score: +0.4 with two conflicting signals
- Price: Close at 0.1592
- Model forecast: Down 56% vs Up 36% vs Side 8%
- Technical trend: Bullish (EMA12>EMA26, SMA50>SMA200, RSI 60; σ24h 0.83%; Vol regime: Very Low)
- RSI: Neutral
- Key levels:
- Support near 0.155
- Major support at 0.145
- Resistance near 0.16
- Major resistance at 0.17
- Forecast range (P50): 0.1562; (P20-P80): 0.1483–0.1696
- Triggers:
- Up: 1h close above 0.16 targets 0.1656–0.1689
- Down: 1h close below 0.155 targets 0.1529–0.1498
- Context:ADA sits between 0.155 support and 0.16 resistance; inside range with no breakout confirmed.
Drivers
- Top drivers (scaled contributions):
- FNG Z-SCORE: +2.55 (value 9.41)
- SPREAD BP: -2.42 (value 2.98)
- GOLD/SILVER RATIO Z-SCORE: +1.33 (value 0.97)
- BTC DOMINANCE: +0.85 (value -1.48)
- LS GLOBAL Z-SCORE: -0.83 (value 2.2)
- VOL OF VOL: -0.73 (value 2.03)
- Market context: Cross-market risk assets softened; stablecoin liquidity contracting; sentiment shows extreme fear.
- Volatility: Very low regime; average true range around 0.001; vol unit 0.001
ETF Flows (BTC/ETH)
Reported ETF flows cover BTC and ETH only. BTC ETFs show persistent outflows: -$231.0M today, -$1.33B over 5 days, and -$1.47B over 10 days. ETH ETFs show -$29.9M today, -$221.5M over 5 days, and -$236.4M over 10 days. This data should be interpreted as context for the broader risk environment, not as a primary signal for ADA. ETF flows indicate risk-off sentiment and liquidity shifts in the largest-cap crypto assets, which can influence correlated markets but do not directly determine ADA price action.
What to Watch Next
- Monitor 1h close around 0.16 for potential breakout/return move toward 0.1656–0.1689 if resistance is breached.
- Watch for a break below 0.155, which could expose 0.1529–0.1498 and shift bias more toward downside in the near term.
- Observe cross-asset liquidity dynamics and BTC dominance shifts, as ETF flow trends in BTC/ETH may signal broader risk-off or risk-on episodes.
- Stay attentive to changes in volatility regime; a shift from Very Low could alter trigger thresholds and risk management considerations.
Hashtags: #ADA #Cardano #CryptoAnalysis #TechnicalAnalysis #ETFFlows #BTC #ETH #MarketSnapshot #PriceLevels #RiskManagement #Liquidity