Market Snapshot
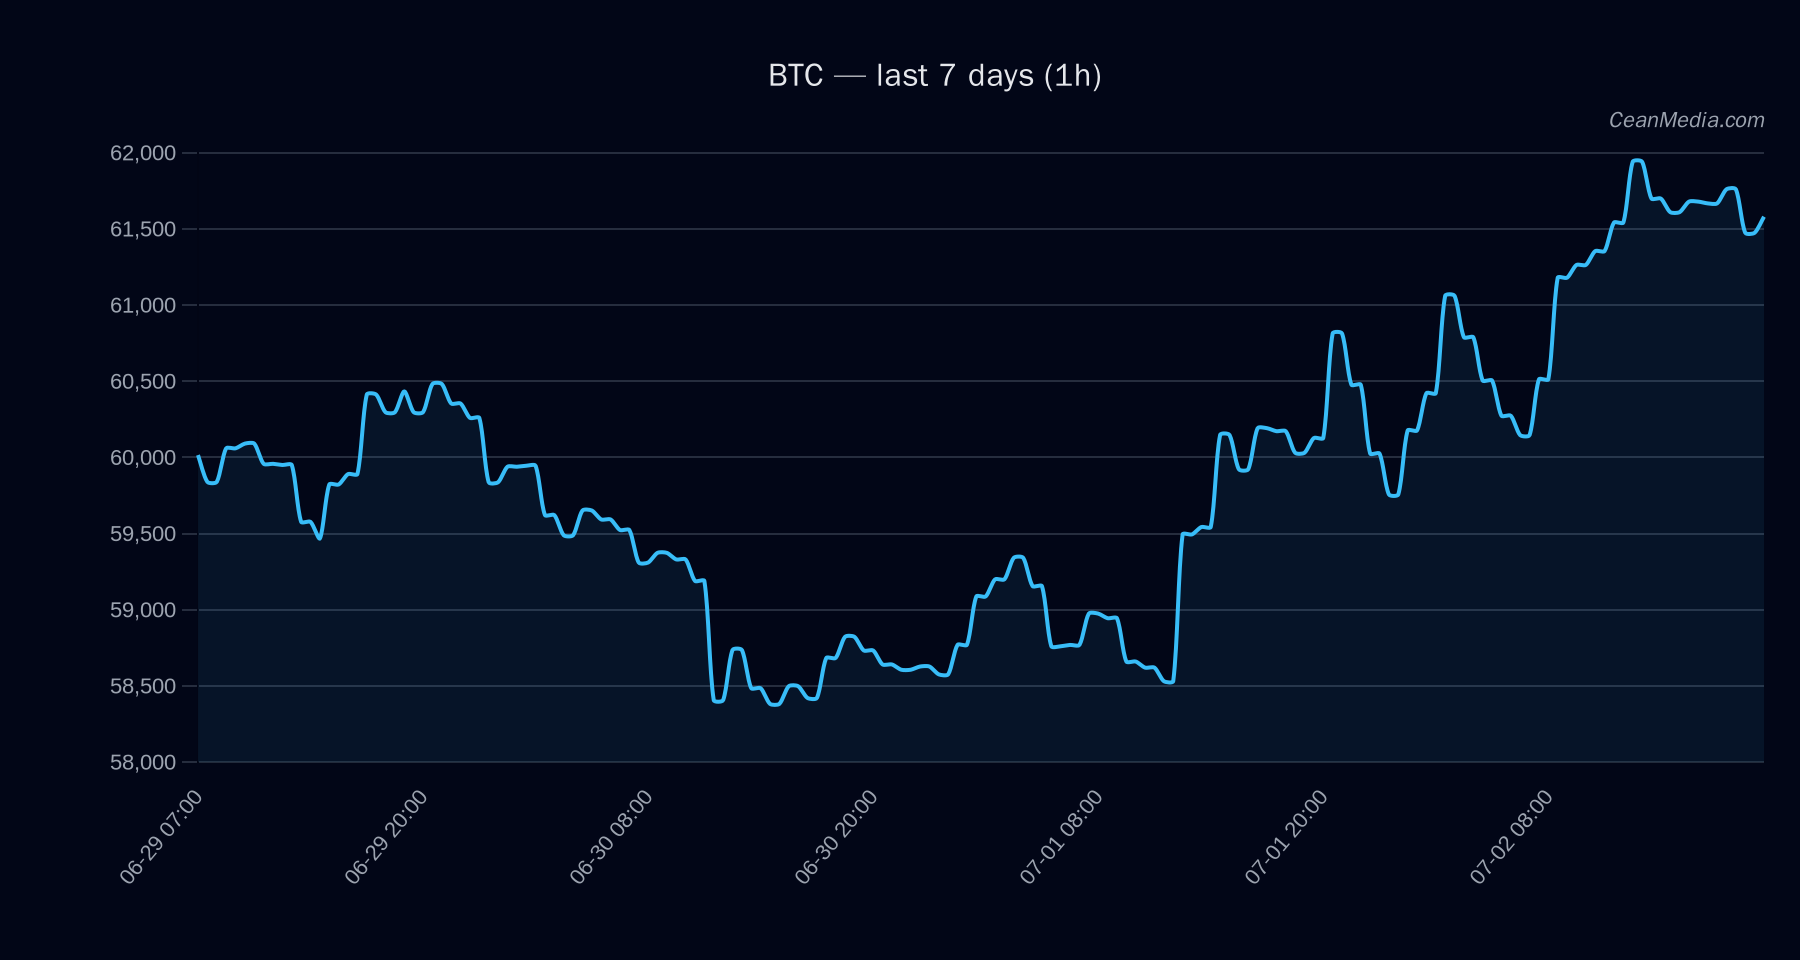
BTC trades around the 61.5k level with a narrow range suggested by very low volatility and mixed macro signals. Market breadth remains strong above the 50-period moving average, while cross-asset risk sentiment indicates a cautious stance. ETF flow data for BTC and ETH shows net outflows over different horizons, providing context but not serving as a primary BTC signal.
Technical Analysis: BTC
-1.0; conflicts 0. Down 45%; Up 39%; Side 16%. sideways; RSI 61. EMA12>EMA26; SMA50 61,304.77; P20-P80: 56,600.04 – 63,559.47. - Up: 1h close > 62,775 → 64,026.653 / 65,282.0775
- Down: 1h close < 60,300 → 59,103.4194 / 57,897.2271
Context notes: The model indicates a down bias with sideways price action and low volatility. Momentum indicators are mildly negative, while cross-asset risk and breadth data remain mixed to cautious.
Drivers
- Top model drivers include: Gold/Silver ratio, Stablecoin market cap, Distance from moving averages, Stock basket returns, and Volatility-of-volatility. These collectively contribute to modest negative tilt despite neutral RSI and range-bound price action.
- Market momentum signals show subdued intraday movement with very low volatility regime; funding and basis z-scores indicate stretched positioning in some segments but not a definitive trend signal.
- BTC-dominance around 55.67% with slight 24h delta; overall correlation to BTC remains high with broad market moves influencing risk appetite.
ETF Flows (BTC/ETH)
ETF flow data presented here covers BTC and ETH, serving as market context rather than a primary BTC signal. BTC ETF flows show a net outflow over 1D (-$231M), 5D (-$1.33B), and 10D (-$1.47B). ETH ETF data likewise shows net outflows over the comparable windows (-$29.9M 1D, -$221.5M 5D, -$236.4M 10D).
Interpretation: The aggregated outflows suggest a cautious to risk-off stance from ETF participants over the observed periods. However, ETF data is supplemental and should not be used in isolation to drive BTC trading decisions. BTC-specific price action remains the primary driver, with ETF flows providing macro-context on risk appetite and liquidity dynamics across major crypto assets.
What to Watch Next
- Watch for a confirmed close above 62,775 to validate a potential resistance breakout toward 64,026–65,282 if price strength and volume pick up.
- Monitor a break below 60,300 for potential downside extension toward 59,103 and 57,897, especially if macro risk indicators worsen.
- Track ETF flow shifts and broader risk sentiment as potential tail-risk indicators for short-term moves, while treating them as context rather than primary signals.
- Observe volatility regime changes and breadth movements to assess the probability of a regime shift from sideways to directional action.
Hashtags: #Bitcoin #BTCAnalysis #CryptoMarket #ETFFlows #TechnicalAnalysis #MarketSnapshot #TradingStrategy #CryptoNews #BTCUSD #RiskManagement #Volatility #MarketContext