Market Snapshot
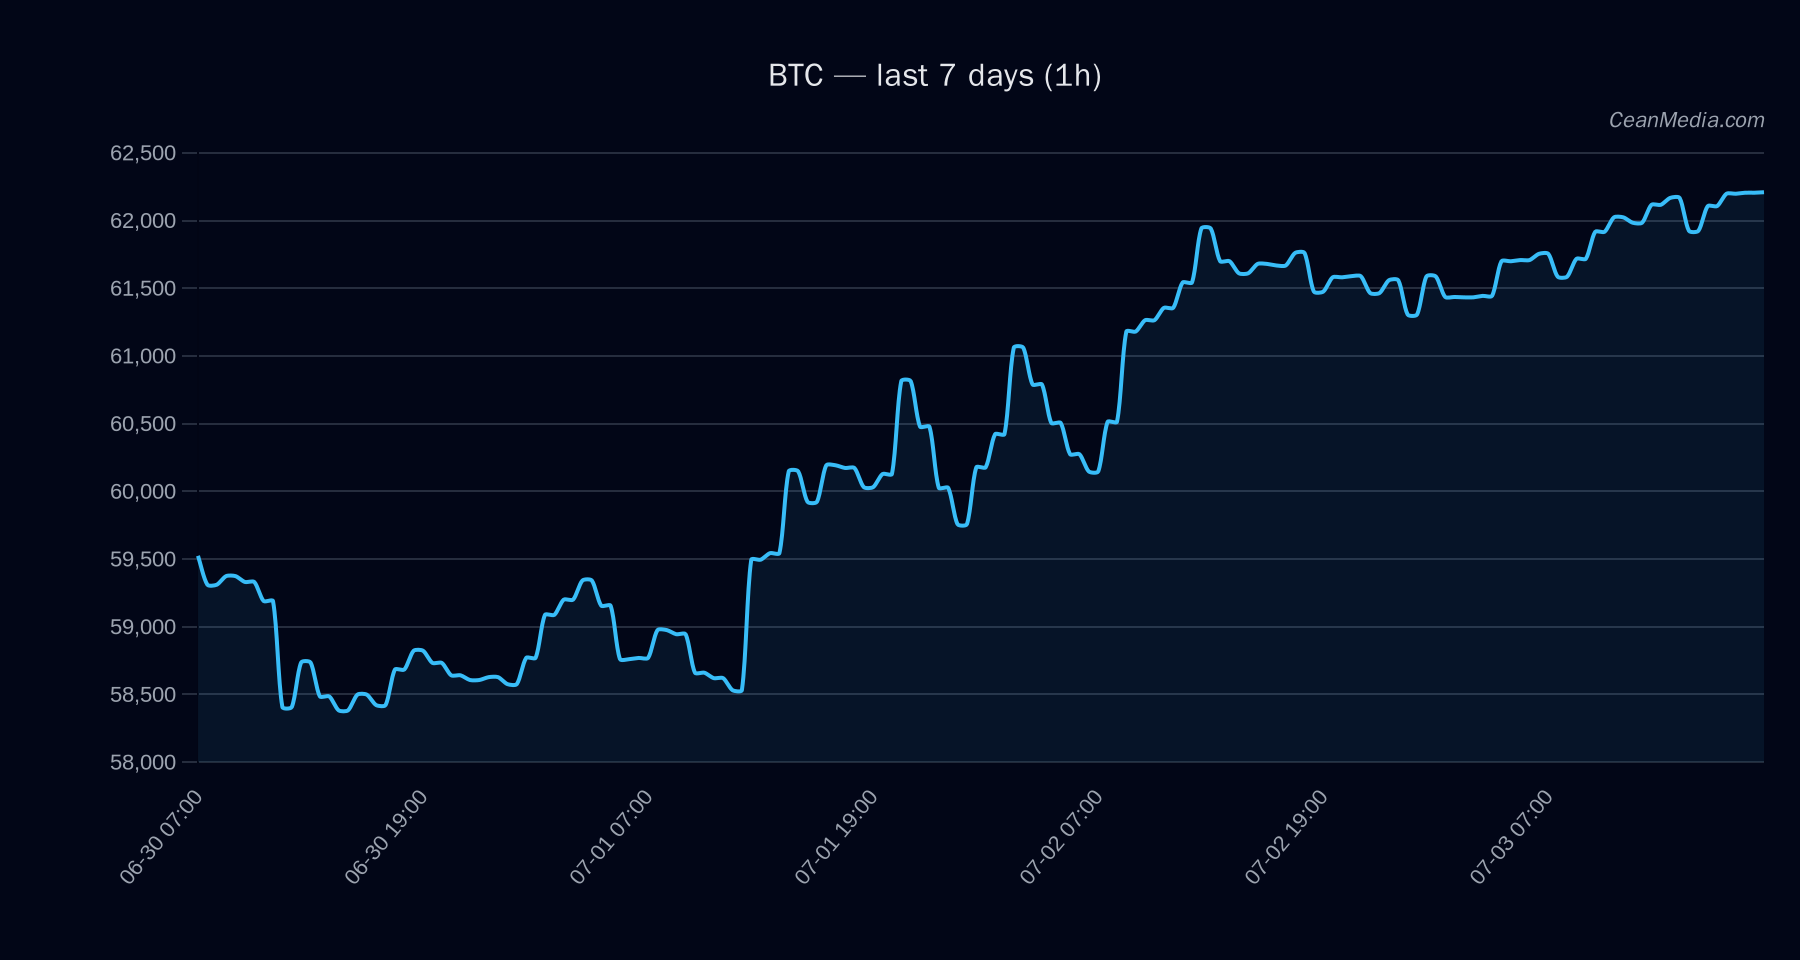
Bitcoin (BTC) remains in a mixed-to-bullish posture as of the latest close around 62,623.65. The model forecast points to a modest up bias (probability ~50%) with a composite TA view indicating bullish conditions but with low certainty. Market breadth is robust (100% above the 50-hour moving average), while overall volatility is very low, signaling a quiet session environment ahead of potential catalytic moves.
Technical Analysis: BTC
- : mixed to bullish pressure; certainty low (8/100).
- Price: Close 62,623.65; intraday context shows key levels—support near 61,375 and resistance near 63,875.
- Trend indicators: EMA12 > EMA26, SMA50 > SMA200, RSI 71.0 indicating overbought nuance; volatility regime: very low (σ24h ~0.26%).
- Forecast range: P50 at 61,969.37; P20-P80 range from 57,621.85 to 64,624.72.
- Key levels:
- Support: 61,375 (major: 59,625)
- Resistance: 63,875 (major: 64,425)
- Triggers:
- Upside trigger: a 1h close above 63,875 targets 65,153.65 – 66,431.17
- Downside trigger: a 1h close below 61,375 targets 60,143.75 – 58,916.33
- Momentum/Volatility: Very low volatility; RSI at overbought territory suggests potential short-term pullbacks or consolidation.
Drivers
- include Stable MCAP log1p, Gold/Silver ratio, Distance from MA, FNG Z-score, LS global Z-score, and Stock Basket Returns. These contribute to a mixed signal with a tilt toward bull case from TA factors.
- Momentum: TA trend is bullish with RSI elevated; market breadth is positive (100% above SMA50).
- Volatility regime: Very low, suggesting reduced breakout potential unless triggered by a catalyst.
- Macro signals: Cross-market risk assets supportive, but sentiment shows extreme fear; stablecoin liquidity contracting in the 7-day view.
ETF Flows (BTC/ETH)
ETF flow data is provided for BTC and ETH only and should be considered contextual rather than a primary signal for BTC price action. Recent figures show BTC ETF flows negative: -$231.0M today, -$1.33B over 5 days, and -$1.47B over 10 days. ETH ETF flows are also negative: -$29.9M today, -$221.5M over 5 days, and -$236.4M over 10 days. ETF flows indicate a net outflow tendency over recent periods, which can contribute to risk-off pressure but must be weighed against on-chain activity and macro drivers.
: -$231.0M (1D); -$1.33B (5D); -$1.47B (10D). : -$29.9M (1D); -$221.5M (5D); -$236.4M (10D). - Interpretation: ETF data points indicate outflows which can reflect risk-off sentiment or reallocations. This is a contextual signal and should not be treated as the primary driver for BTC price movements.
What to Watch Next
- Watch for a close above 63,875 on any 1h/4h candle to validate upside continuation toward 65,153–66,431.
- Monitor for a break below 61,375 to confirm downside protection measures targeting 60,144–58,916.
- Observe ETF flow trends alongside on-chain metrics for divergent signals that could precede a price move.
- Keep an eye on RSI behavior around 70–75 and changes in volatility regime, which could precede a breakout or relief rally.
Hashtags: #BTC, #BitcoinAnalysis, #CryptoMarkets, #TradingStrategy, #ETFFlows, #MarketOutlook, #TechnicalAnalysis, #PriceLevels, #MarketSentiment, #Liquidity, #Volatility, #RiskOn