Market Snapshot
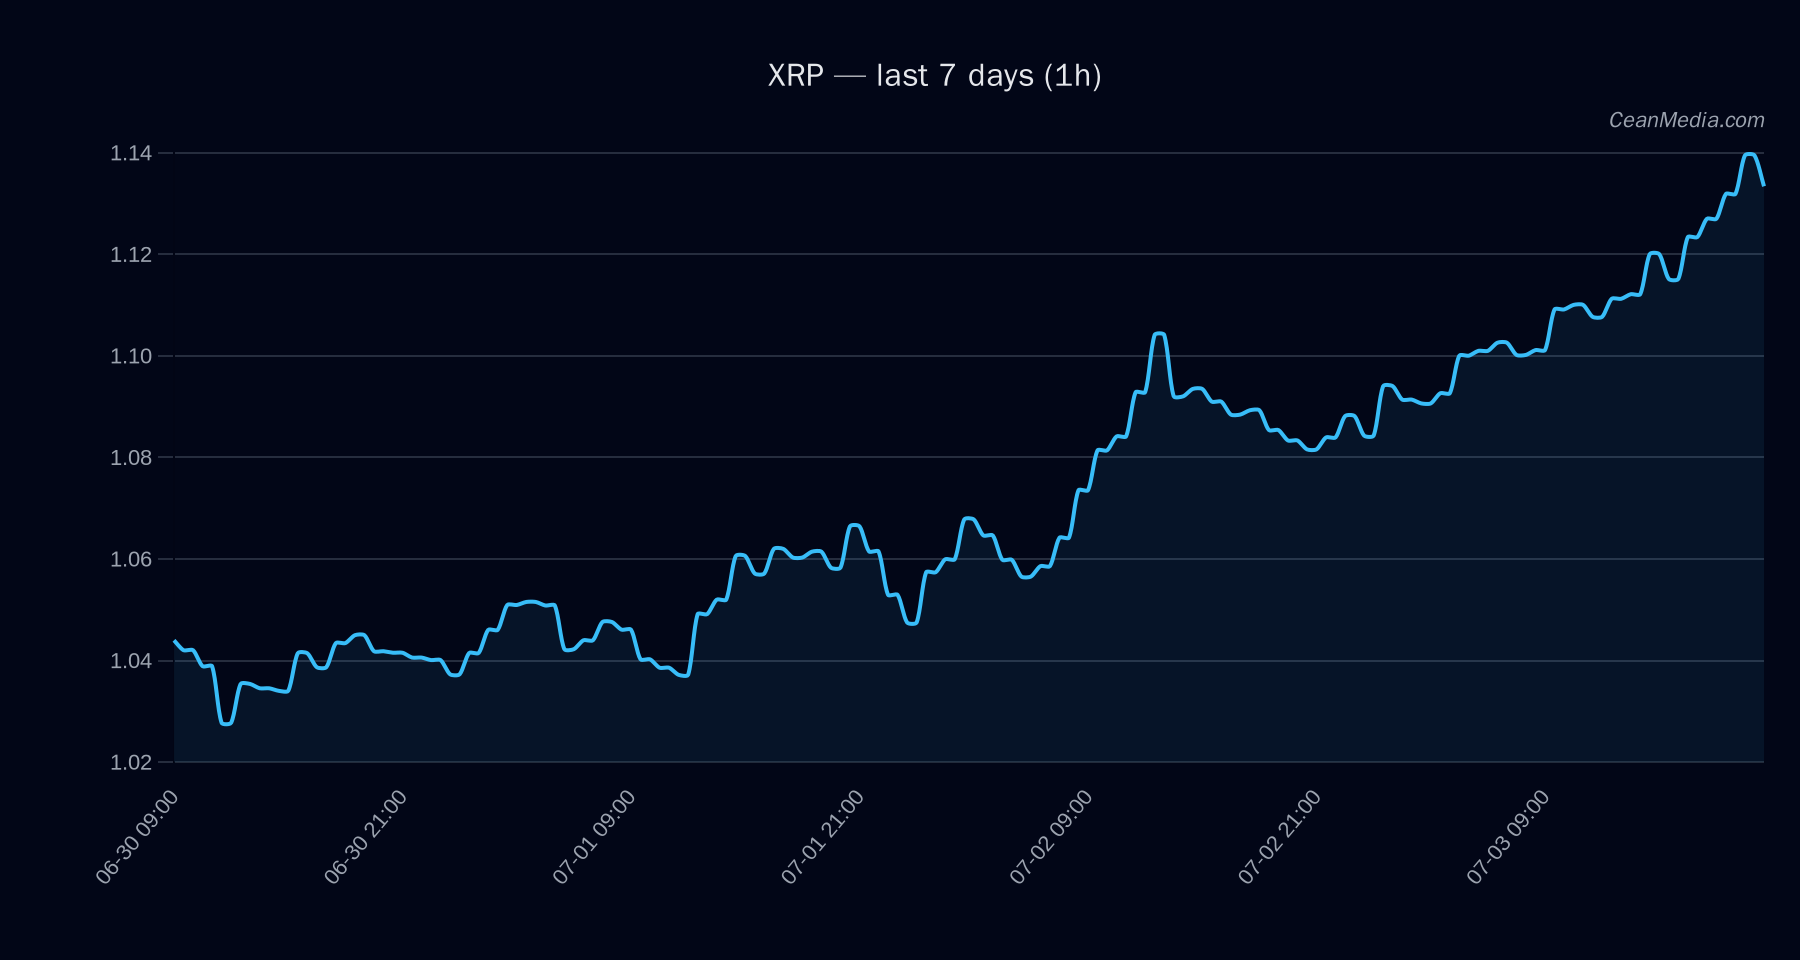
Primary asset: XRP. Recent close at 1.1317 with a mixed/neutral bias and low certainty (9/100). The composite score is +0.6 with no conflicts. Market context shows very low volatility, 100% breadth above its 50-period moving average, and a BTC correlation of 0.79 over 72 hours. Extreme Fear readings (F&G 21) persist, and stablecoin liquidity shows contraction over a 7-day window.
Technical Analysis: XRP
EMA12>EMA26, SMA50>SMA200, RSI at 70; volatility regime: Very low; σ24h = 0.41% P50 = 1.1328; typical range 0.999 – 1.1904 (P20-P80) TA trend is bullish while the model forecast leans to a downside direction with 48% probability; RSI currently neutral Support near 1.10, major support at 1.04; Resistance near 1.16, major resistance at 1.16 - Up: 1h close > 1.16 implies potential moves toward 1.1774 and 1.2005
- Down: 1h close < 1.10 implies potential moves toward 1.0869 and 1.0647
Drivers
Return 24h: 0.05; EMA slope: 0.0019; Funding Z-score: 1.17; Basis Z-score: 0.88; Order-book imbalance (EMA5): 0.0347; Bitcoin 24h return: 0.0185 Vol regime: Very low; BTC correlation 0.79; Alt breadth: 100% above SMA50 Cross-market risk assets supportive (1.35%); Stablecoin liquidity contracting; Sentiment: Extreme Fear (21)
ETF Flows (BTC/ETH)
The ETF flow data provided covers BTC and ETH and is context for market liquidity and risk appetite. It is not a primary signal for XRP price action. Current snapshot shows: BTC ETFs down by $231.0M today, with larger declines over 5- and 10-day horizons (-$1.33B and -$1.47B respectively). ETH ETFs down by $29.9M today, with 5- and 10-day declines of -$221.5M and -$236.4M. These flows suggest a risk-off tilt in the broader crypto market, which can influence XRP indirectly through cross-asset risk sentiment and funding dynamics.
What to Watch Next
- Monitor 1h close relative to 1.16 resistance for potential breakout or rejection cues
- Watch for intraday moves below 1.10 to assess downside validation toward 1.0869/1.0647
- Keep an eye on ETF flow trends in BTC/ETH as a broad risk-sentiment proxy, noting that XRP is not directly tied to ETF signals
- Assess changes in volatility regime and breadth signals to confirm or invalidate the current bullish TA bias
Hashtags: #XRP #CryptoAnalysis #TechnicalAnalysis #BTC #ETH #ETFFlows #MarketSnapshot #TradingStrategy #Liquidity #RiskSentiment