
Market Snapshot
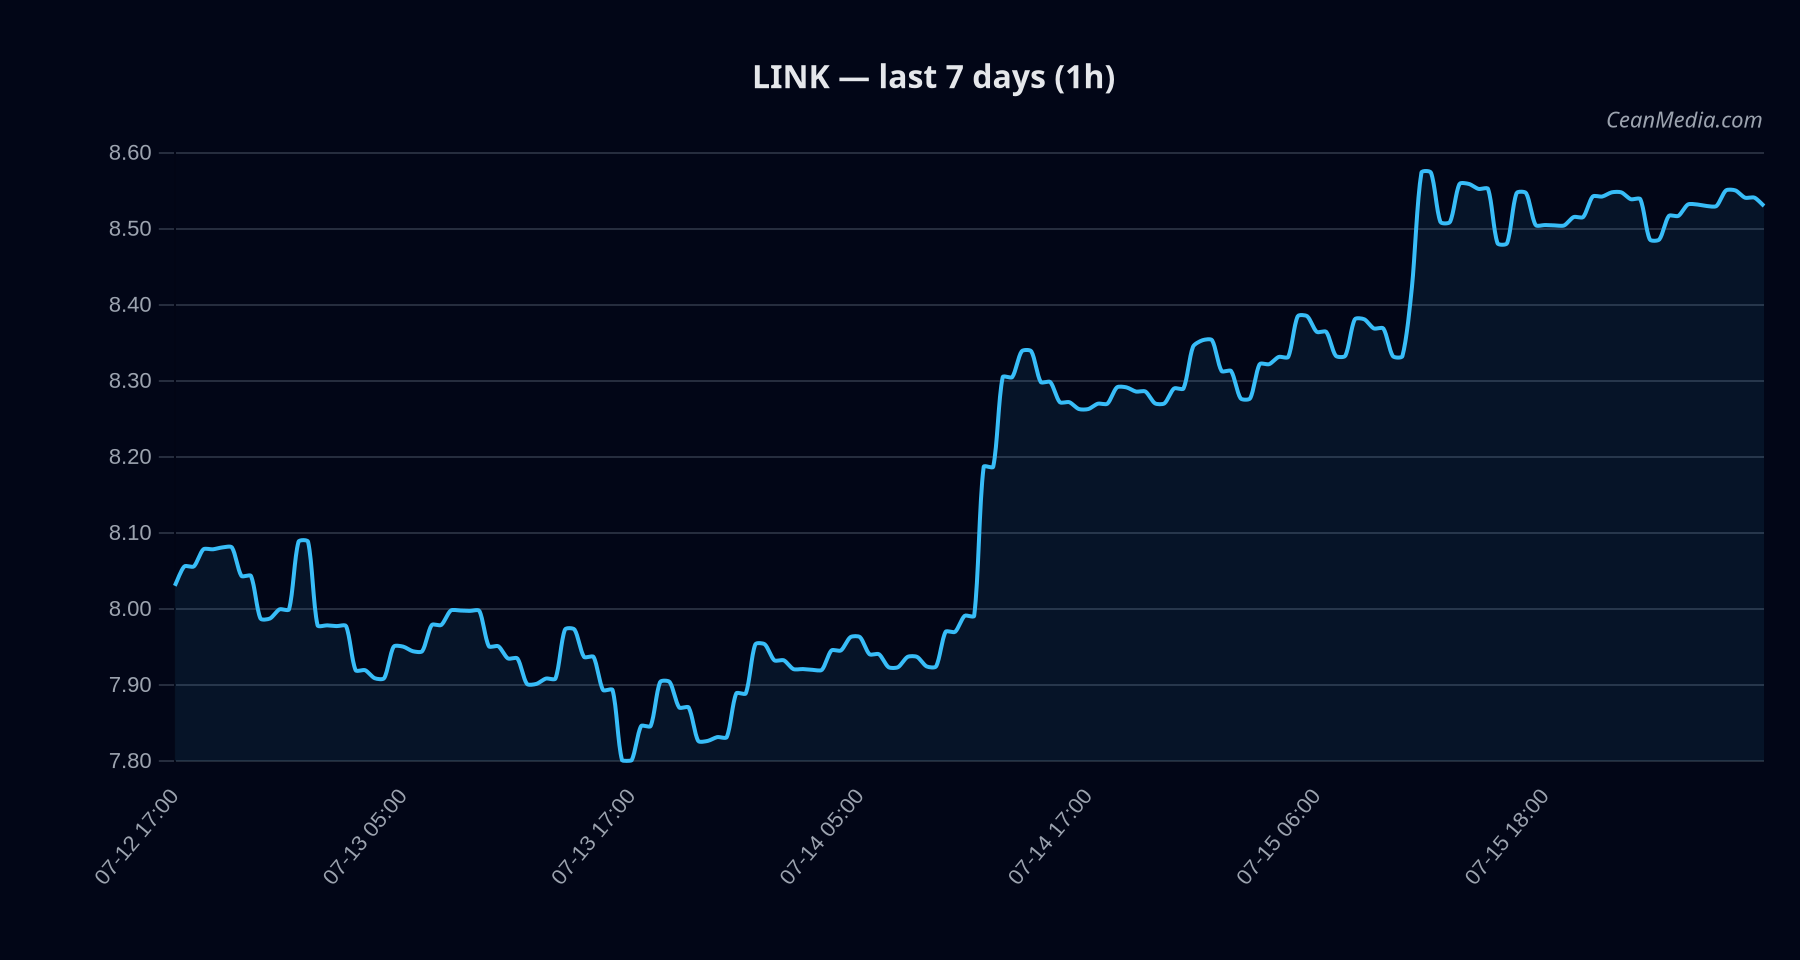
On July 16, 2026, LINK trades around the mid-8s per token, with a bullish technical setup and a conservative forecast range. Market breadth remains strong, with 83% of assets above the 50-day moving average and a BTC correlation of 0.71 over 72 hours. Overall risk sentiment shows extreme fear (F&G 25), while cross-market signals suggest risk assets are broadly supported in the near term.
Technical Analysis: LINK
- bullish; certainty: medium (46/100)
- +3.3; conflicts: 0
- Close around 8.539
- Up (48%); Up is the dominant signal with a notable probability of sideways or down moves (8% and 43%, respectively).
- bullish; RSI 60
- EMA12 > EMA26, SMA50 > SMA200, RSI 60, volatility (σ24h) 0.58%, very low vol regime
- Support near 8.36; major support 7.72; Resistance near 8.7; major resistance 8.28
-
- Up: 1h close > 8.7 ⇒ potential target 8.884 to 9.0582
- Down: 1h close < 8.36 ⇒ potential target 8.2009 to 8.0335
- P50 = 8.4278; P20-P80 = 7.8852 – 9.0889
- Volatility very low; breadth 83% above SMA50; BTC corr 0.71
Drivers
- Top drivers (by contribution): GOLD/SILVER RATIO (1.18), FNG Z-SCORE (-0.84), BTC DOMINANCE (-0.8), SPREAD BP (0.73), GOLD/SILVER RATIO Z-SCORE (-0.64), VIX Z-SCORE (-0.56)
- Momentum and volatility signals indicate a measured risk environment with directional bias leaning positive but with caution due to mixed momentum indicators.
- Short-term price-distance from moving averages is modest (distance from MA ~ 2.77%), aligning with a bullish tilt but requiring a break of key levels for confirmation.
ETF Flows (BTC/ETH)
Contextual note: ETF flow data shown here pertains to BTC and ETH only and should be considered as macro risk sentiment context, not a primary signal for LINK trading decisions. The data indicates notable fund outflows on BTC and smaller, mixed activity for ETH, which may reflect broader risk-off pressures or hedging activity.
- BTC ETF: -$424.7M (1D), -$570.2M (5D), -$1.76B (10D)
- ETH ETF: -$15.4M (1D), -$6.3M (5D), -$210.7M (10D)
What to Watch Next
- Watch for a close above 8.7 to validate upside trigger towards the 8.884 – 9.0582 range.
- Monitor for a break below 8.36 as invalidation against the bullish view, potentially pulling price toward 8.2009 – 8.0335.
- Observe shifts in BTC dominance and overall ETF flow signals as potential macro catalysts.
- Keep an eye on volatility regime: remains very low, but any sudden expansion could alter risk-reward dynamics.
Hashtags: #LINK #CryptoMarkets #TechnicalAnalysis #ETFFlows #Bitcoin #Altcoins #MarketView #PriceAction #Liquidity #RiskManagement