
Market Snapshot
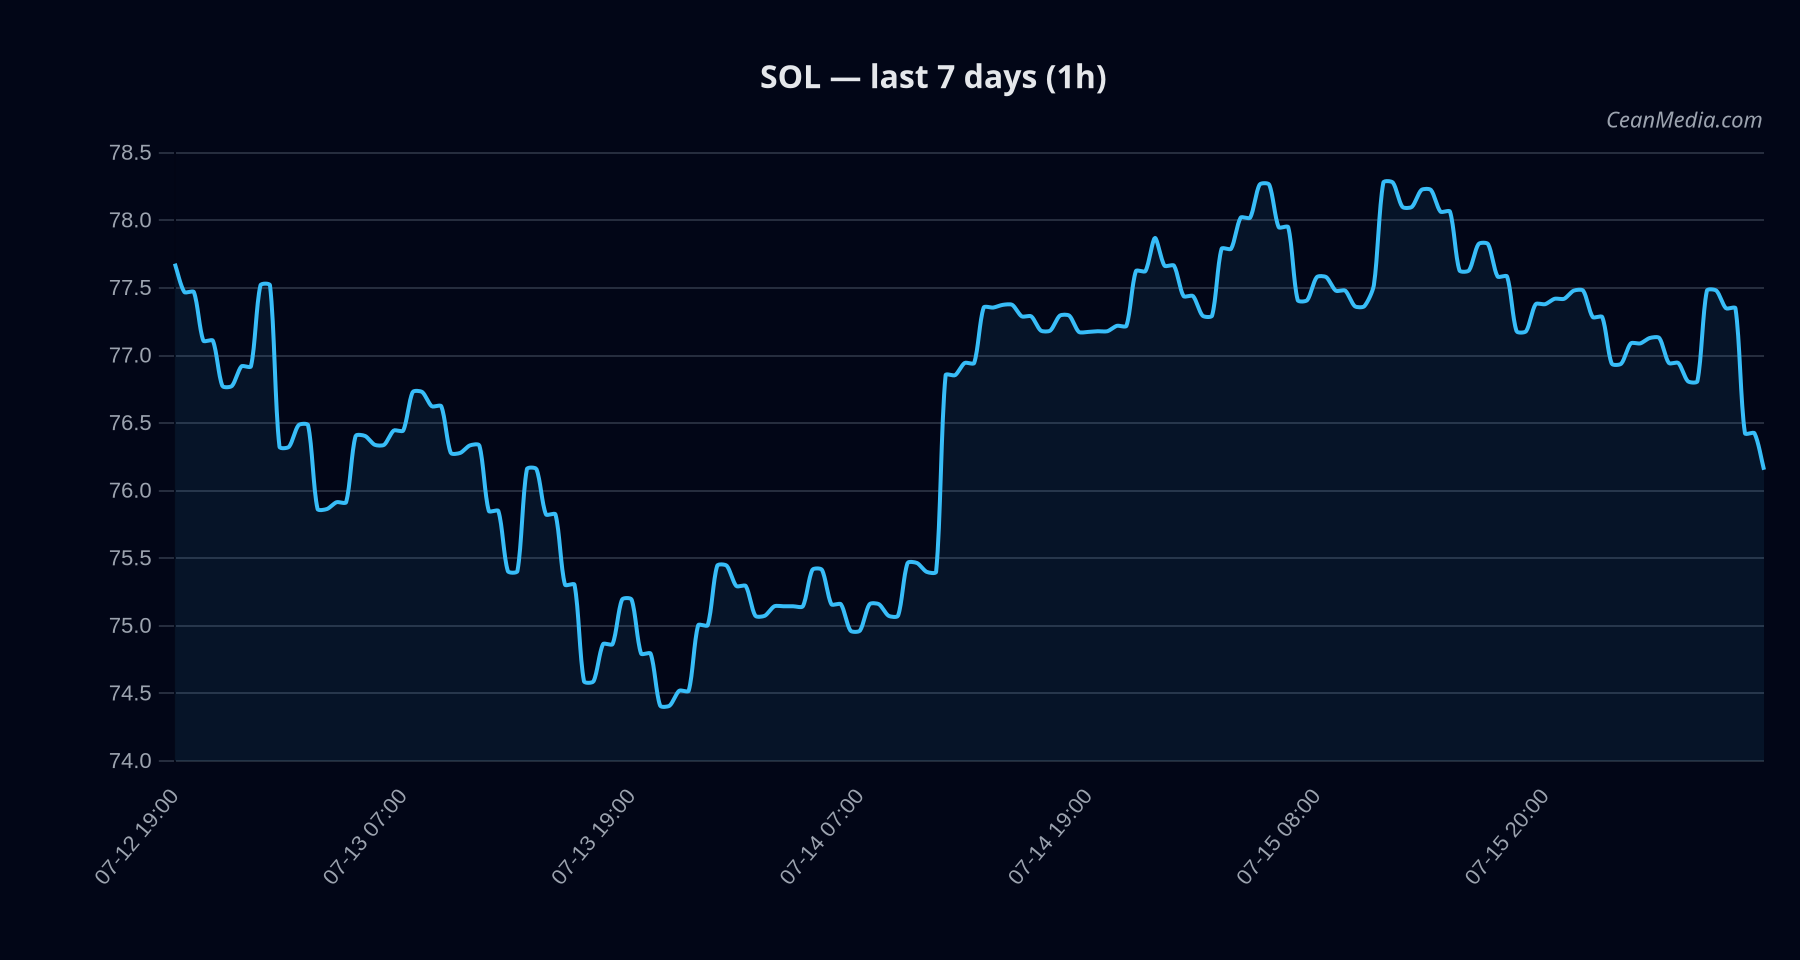
Solana (SOL) sits in a narrow trading range with subdued volatility. The latest data indicate a slightly bearish tilt with a low confidence level. The current price sits near key support and resistance levels, with breakouts corresponding to notable target levels. Broad market indicators show very low volatility and mixed breadth, while cross-market signals suggest risk assets have tentative support but sentiment remains in extreme fear.
Technical Analysis: SOL
- Current Price: 76.13
- Bias: slightly bearish (certainty 25/100)
- Composite score: -1.8
- TA Trend: bearish
- RSI: 36
- Key Moving Averages (EMA/SMA): EMA12 < EMA26; SMA50 < SMA200
- Volatility: σ24h 0.44%, very low volume regime
- Levels: Support near 74.6; Major support 75.1; Resistance near 77.7; Major resistance 80.2
- Forecast Range (P50/P20-P80): 75.041 / 73.875–81.0713
- Triggers:
- Up: 1h close > 77.7 => 79.2057 / 80.7587
- Down: 1h close < 74.6 => 73.1153 / 71.6231
Context: Breadth is light (17% above SMA50); BTC correlation 0.88; F&G (Fear & Greed) at 25 (Extreme Fear). The model assigns a sideways forecast with a bearish TA bias and low confidence.
Drivers
BTC Dominance (-0.42), Depth Z-Score (-0.37), AAPL 1D Return (+0.35), Gold/Silver Ratio Z-Score (+0.29), LIQ IMB EMA12 (+0.26), TBI EMA10 (+0.24) Cross-market risk assets showing tentative support; overall market breadth remains limited Taker buy pressure (23.2%); long positioning slightly crowded (1.57x) Extreme fear in investor sentiment; ETF flows for BTC/ETH indicate net outflows in recent periods
ETF Flows (BTC/ETH)
ETF flow data provided here covers BTC and ETH only and should be interpreted as context for overall risk appetite, not as a primary signal for SOL. Recent data show continued outflows in BTC ETFs over 1D, 5D, and 10D horizons, with ETH ETFs also negative on 1D and 5D bases. This pattern suggests a cautious or risk-off environment that can influence correlated assets, but SOL-specific signals should be evaluated independently of ETF flow directions.
1D -$424.7M | 5D -$570.2M | 10D -$1.76B 1D -$15.4M | 5D -$6.3M | 10D -$210.7M
What to Watch Next
- Watch for a close above 77.7 to signal a potential test toward 80.2 and higher levels; invalidate with a close below 74.6.
- Monitor volatility regime and breadth signals for any shift from very low to higher activity, which could precede sharper moves.
- Consider interactions with broad market risk appetite and BTC dominance dynamics, as these impact SOL’s cross-asset correlations.
- Stay attentive to any change in RSI momentum (currently ~36) that could precede trend changes if price holds above key supports.
Hashtags: #Solana #SOL #CryptoAnalysis #MarketSnapshot #TechnicalAnalysis #ETFFlows #BTC #ETH #RiskOn #TradingStrategy #CryptoNews #Blockchains