
Market Snapshot
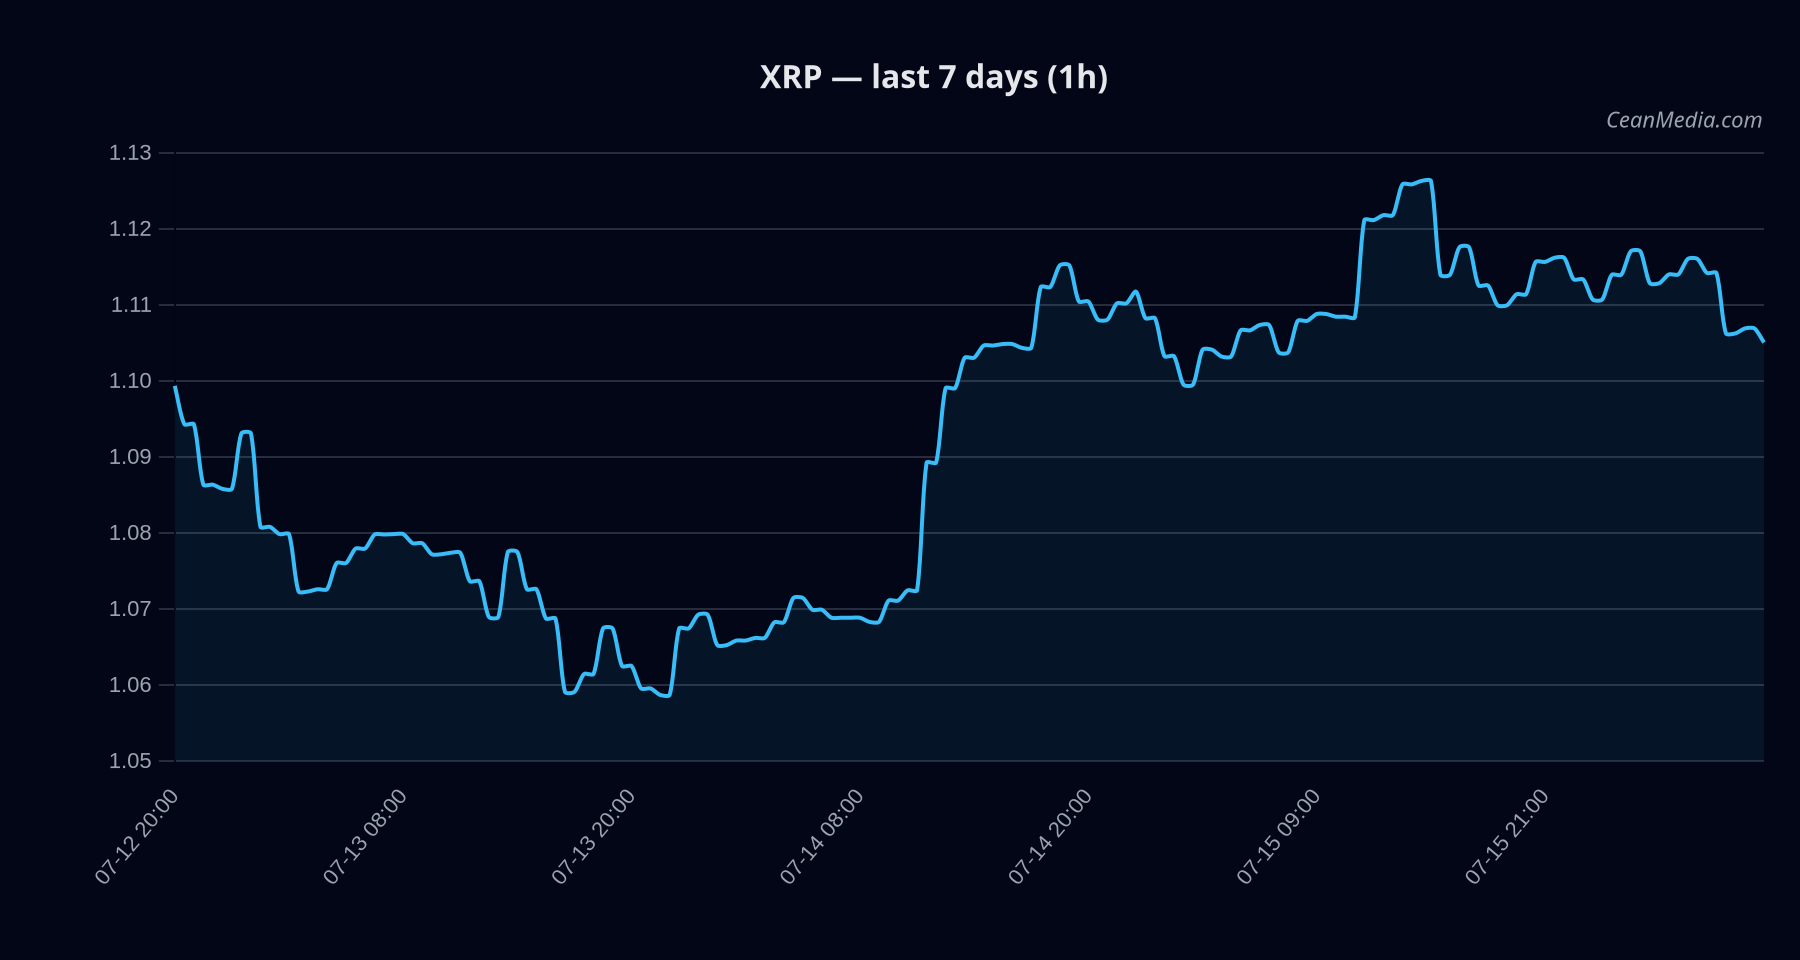
As of 2026-07-16, XRP trades near 1.1074 with a very low volatility regime. The market backdrop shows broad risk assets generally supportive, while on-chain and sentiment indicators indicate a cautious stance with extreme fear readings in certain datasets. BTC dominance trend over 7 days shows a notable metric, but the composite technical view for XRP remains slightly bullish with a sideways forecast tendency.
Technical Analysis: XRP
- Slightly bullish
- +2.3 (conflicts 0)
- Close at 1.1074
- Trend interpretation: TA trend bullish with EMA12>EMA26, SMA50>SMA200; RSI at 46; sigma 24h 0.42%; very low vol regime.
- Forecast: Sideways with probability 24% in the 24-hour horizon; Up 36%, Down 40% (model forecast).
- Key levels:
- Support near 1.08
- Major support near 1.06
- Resistance near 1.12
- Major resistance near 1.14
- Triggers:
- Up: 1h close above 1.12 targets 1.1521 / 1.1747
- Down: 1h close below 1.08 targets 1.0635 / 1.0418
- Invalidation: No explicit invalidation level provided beyond the trigger framework; indicators reflect a non-breakout context with a general sideways bias.
- Contextual notes: Breadth is limited (17% above SMA50); BTC correlation ~0.77 over 72 hours. Overall, the current setup favors a cautious hold with attention to trigger levels for confirmation.
Drivers
- BTC dominance trend (7D): major contribution observed (value -12,158.34; trend direction indicates mixed signals with a notable decline metric)
- RV 7D: marginal negative contribution
- GOLD/SILVER ratio z-score: modest positive signal
- Volatility of volatility (vol of vol): modest negative influence
- Spread basis points: mixed influence with a positive draw
- Stock AAPL return (1D): mild positive influence
- Volatility remains very low; alt breadth (ex-mega) around 50%; F&G indicator shows Extreme Fear at 25; ETF flows indicate BTC/ETH-centric positioning, not XRP-specific signals.
ETF Flows (BTC/ETH)
Contextual note: ETF flow data presented here covers BTC and ETH only and should not be interpreted as XRP signals. The data provide a macro backdrop for risk appetite and liquidity conditions that may influence XRP indirectly.
- BTC ETF Flows: 1D -$424.7M; 5D -$570.2M; 10D -$1.76B
- ETH ETF Flows: 1D -$15.4M; 5D -$6.3M; 10D -$210.7M
The BTC/ETH ETF flows suggest a persistent outflow trend over multiple horizons, which can reflect broader risk-off dynamics or shifting capital between crypto assets. This context is relevant for sentiment and liquidity but should not be construed as a direct XRP trading signal.
What to Watch Next
- Watch for a 1h close above 1.12 to validate a potential move toward 1.1521–1.1747.
- Monitor any break below 1.08 for acceleration toward 1.0635–1.0418.
- Keep an eye on BTC dominance trend and overall risk-on/off mood, as macro shifts can influence XRP correlation patterns.
- Assess changes in market breadth and alt/mega breadth to gauge participation levels for XRP moves.
Hashtags: #XRP #CryptoMarkets #TechnicalAnalysis #ETFFlows #BTC #ETH #MarketSnapshot #RiskOnOff #TradingStrategy #PriceAction #Liquidity