
Market Snapshot
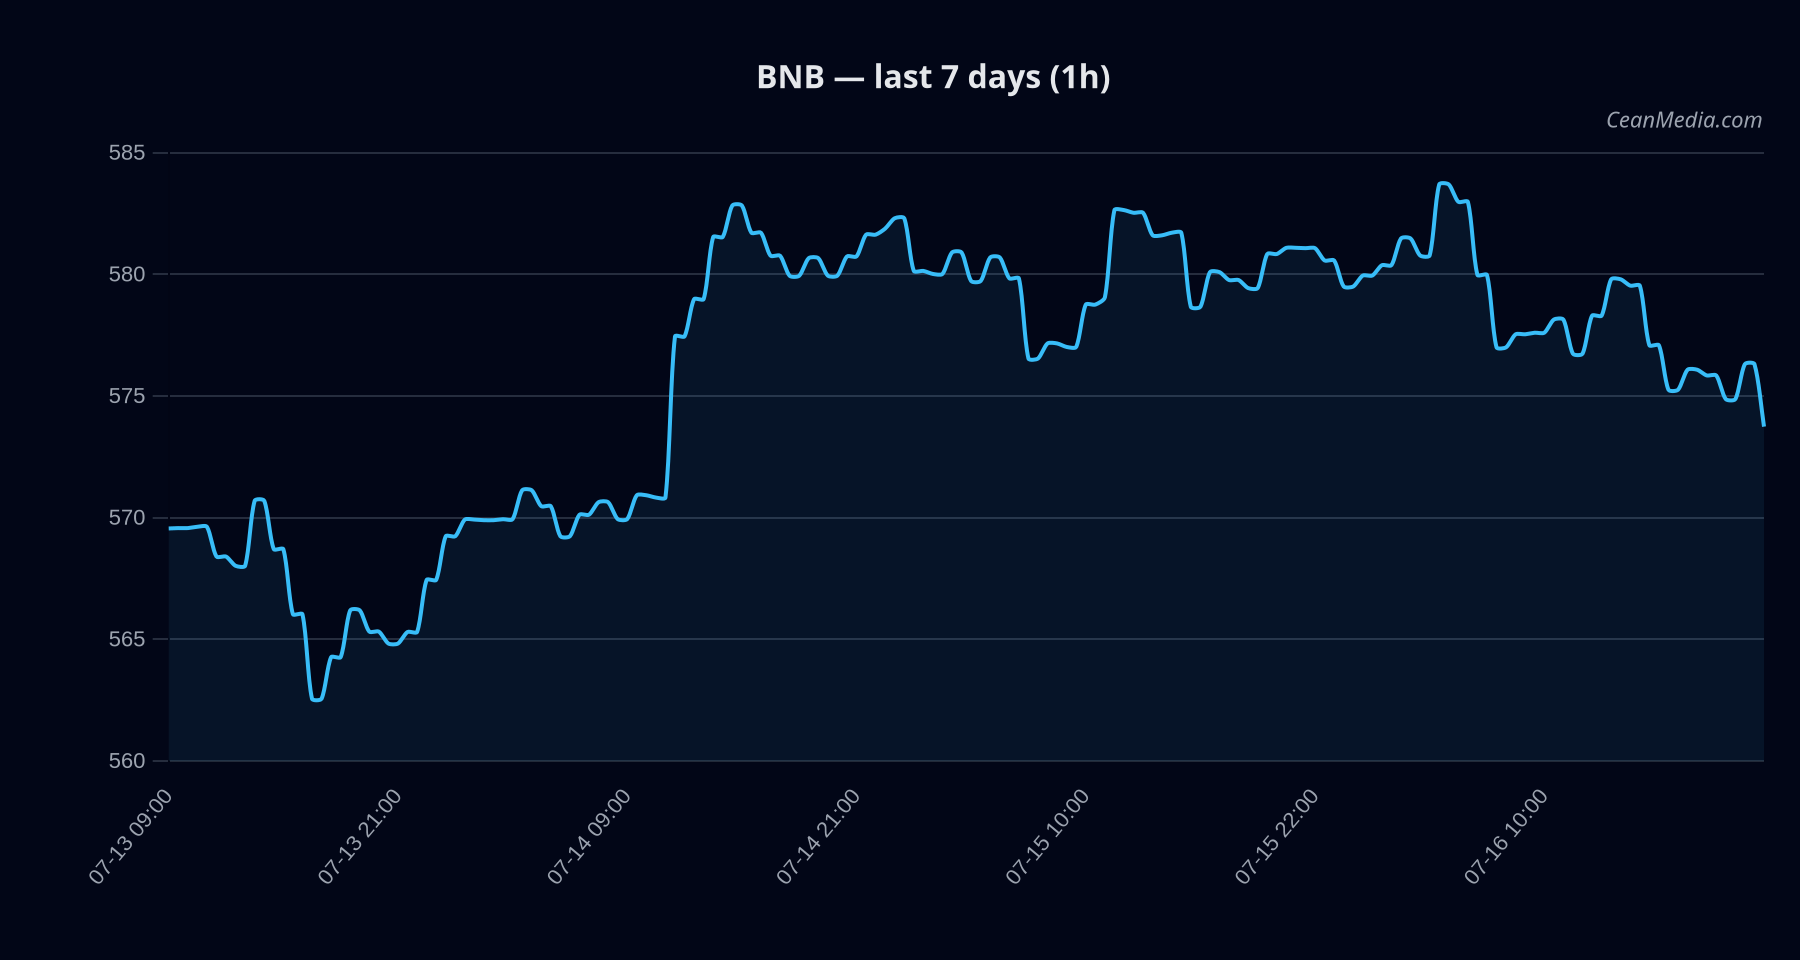
As of 2026-07-16, BNB traded around 573.28 with evidence of a cautious bias. The model assigns a slightly bearish stance with low certainty (35/100). Price action is characterized by a sideways technical trend, supported by a relatively weak RSI of 37 and low intraday volatility (σ24h 0.27%). The composite score is -2.5 with no conflicting signals flagged.
Technical Analysis: BNB
573.28 (Close). - Support near 562 (near-term)
- Major support near 552
- Resistance near 585 (near-term)
- Major resistance near 582
571.93 with a broader 20th–80th percentile range of 559.31 to 589.48. - Up: 1h close > 585 → potential targets 596.44 and 608.14.
- Down: 1h close < 562 → potential targets 550.58 and 539.34.
Price remains within a defined range; no breakout confirmed yet. Breadth currently at 0% above SMA50, BTC correlation 0.81, and overall risk sentiment is extreme fear (25).
Drivers
SPREAD BP, STABLE MCAP LOG1P, GOLD SILVER RATIO Z-SCORE, STOCK BASKET RET 5D, RV 24H, VOL OF VOL. Trend strength indicates mixed signals with distanced draws from major moving averages; volatility regime described as very low. Funding Z-Score is elevated (0.87), Basis Z-Score negative (-0.84), and Order-Book Imbalance (EMA5) negative (-0.24). Breadth poor (0% above SMA50) suggesting limited broad-based participation.
ETF Flows (BTC/ETH)
Contextual note: ETF flow data shown pertains to BTC and ETH only and is provided for market-wide risk context, not as a primary signal for BNB. Current data indicate net outflows across BTC ETFs (-$424.7M on 1D; -$570.2M on 5D; -$1.76B on 10D) and ETH ETFs (-$15.4M on 1D; -$6.3M on 5D; -$210.7M on 10D).
The outflow pattern suggests a cautious or risk-off environment affecting market liquidity and sentiment, which can interplay with altcoin dynamics but should not be taken as a direct signal for BNB movements.
What to Watch Next
- Monitor for a breakout above 585 (near-term resistance) to validate potential upside toward 596–608.
- Watch for a break below 562 (near-term support) to signal a downside path toward 550–539.
- Observe changes in ETF flows context, as continued BTC/ETH outflows may reinforce risk-off conditions affecting altcoins.
- Track RSI and volatility shifts (RSI moving away from oversold territory) to confirm any shift in momentum.
Hashtags: #BNBAnalysis #CryptoMarkets #TechnicalAnalysis #ETFFlows #BTC #ETH #MarketOutlook #Altcoins #RiskOnOff #PriceLevels #Liquidity
Note: ETF data is included for contextual risk framing and should not be used in isolation to make trading decisions about BNB.