
Market Snapshot
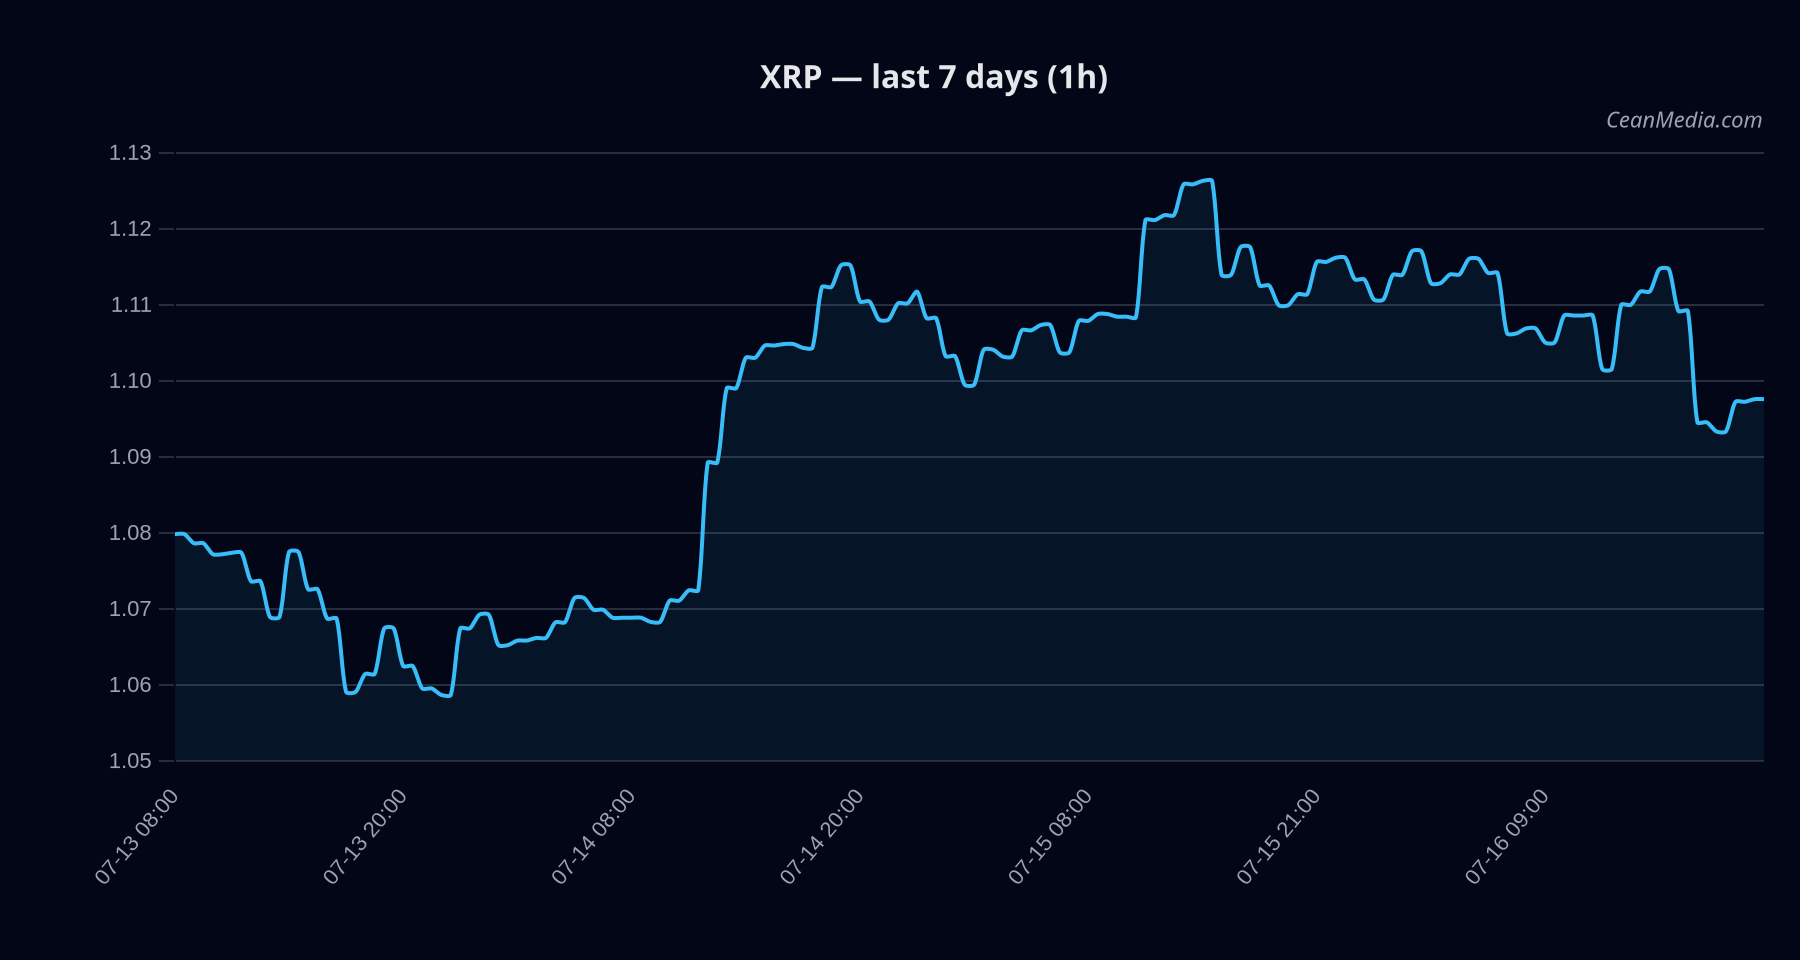
As of the latest reading, XRP trades around 1.0985 with a short-term bias skewed toward resilience but remains within a tight range. Market context shows very low volatility and a broad risk-off tone as indicated by extreme fear signals in the macro gauges. ETF flow data available focuses on BTC and ETH, providing context for risk sentiment rather than a direct XRP signal.
Technical Analysis: XRP
Bias: Slightly bullish; certainty low (14/100). Composite score +1.0 with no conflicting signals.
Price Action: Close at 1.0985. Forecast range (P50): 1.1182; P20-P80: 1.0234–1.1183. Current price sits inside a defined channel between support and resistance levels.
Levels:
- Support: near 1.08
- Major support: 1.06
- Resistance: near 1.12
- Major resistance: 1.14
Triggers:
- Upside: Close > 1.12 within 1h → potential move toward 1.1429 / 1.1653
- Downside: Close < 1.08 within 1h → potential move toward 1.055 / 1.0335
Technical Trend: Sideways. RSI at 42, EMA12 < EMA26, SMA50 > SMA200, volatility (σ24h) 0.43%, very low vol regime.
Invalidation/Notes: TheTA indicates a sideways phase; a break above 1.12 or below 1.08 would provide directional confirmation against the prevailing range-bound backdrop.
Momentum & Volatility: Vol regime is very low; breadth is weak (0% above SMA50). BTC correlation over 72h is strong at 0.76, suggesting broader market correlation during low volatility periods.
Drivers
- Top drivers (by contribution):
- FNG Z-SCORE: +1.83 (value 6.68)
- LIQ IMB Z-SCORE: -1.79 (value -12.66)
- SPREAD BP: -1.72 (value 5.35)
- GOLD:SILVER RATIO Z-SCORE: +0.99 (value 1.1)
- GOLD:SILVER RATIO: -0.95 (value 0.81)
- STABLE MCAP LOG1P: -0.63 (value -2)
Market Context: Across-market risk assets are considered supportive, but sentiment reads as extreme fear (25). The XRP model forecasts a down tilt with a sideways TA signal and a modest net negative bias in the near term.
ETF Flows (BTC/ETH)
The ETF flow data provided is limited to BTC and ETH and is intended as a contextual read on market risk appetite rather than a direct XRP signal. Latest data show:
- BTC ETF: -$424.7M (1D), -$570.2M (5D), -$1.76B (10D)
- ETH ETF: -$15.4M (1D), -$6.3M (5D), -$210.7M (10D)
Interpretation: The net outflows in BTC/ETH ETFs suggest a risk-off posture or consolidation pressure in the broader crypto market. While XRP’s own technicals point to a range-bound setup, the ETF context underscores a cautious backdrop, and should not be treated as a XRP-specific signal. traders may factor correlations and liquidity dynamics from BTC/ETH into risk management and position sizing, particularly in low-volatility regimes.
What to Watch Next
- Monitor for a close above 1.12 to validate a potential breakout toward 1.1429–1.1653.
- Watch for a break below 1.08 to confirm a move toward 1.055–1.0335.
- Assess changes in BTC/ETH ETF flows as a proxy for risk sentiment, noting that ETF data is contextual and not a primary XRP signal.
- Keep an eye on macro indicators that reflect fear/extreme fear levels, which may influence momentum in XRP’s range.
Hashtags: #XRP #CryptoAnalysis #TechnicalAnalysis #MarketSnapshot #ETFFlows #RiskOnOff #BTC #ETH #Liquidity #Volatility
Hashtags: #XRP #CryptoAnalysis #TechnicalAnalysis #MarketSnapshot #ETFFlows #RiskOnOff #BTC #ETH #Liquidity #Volatility