
Market Snapshot
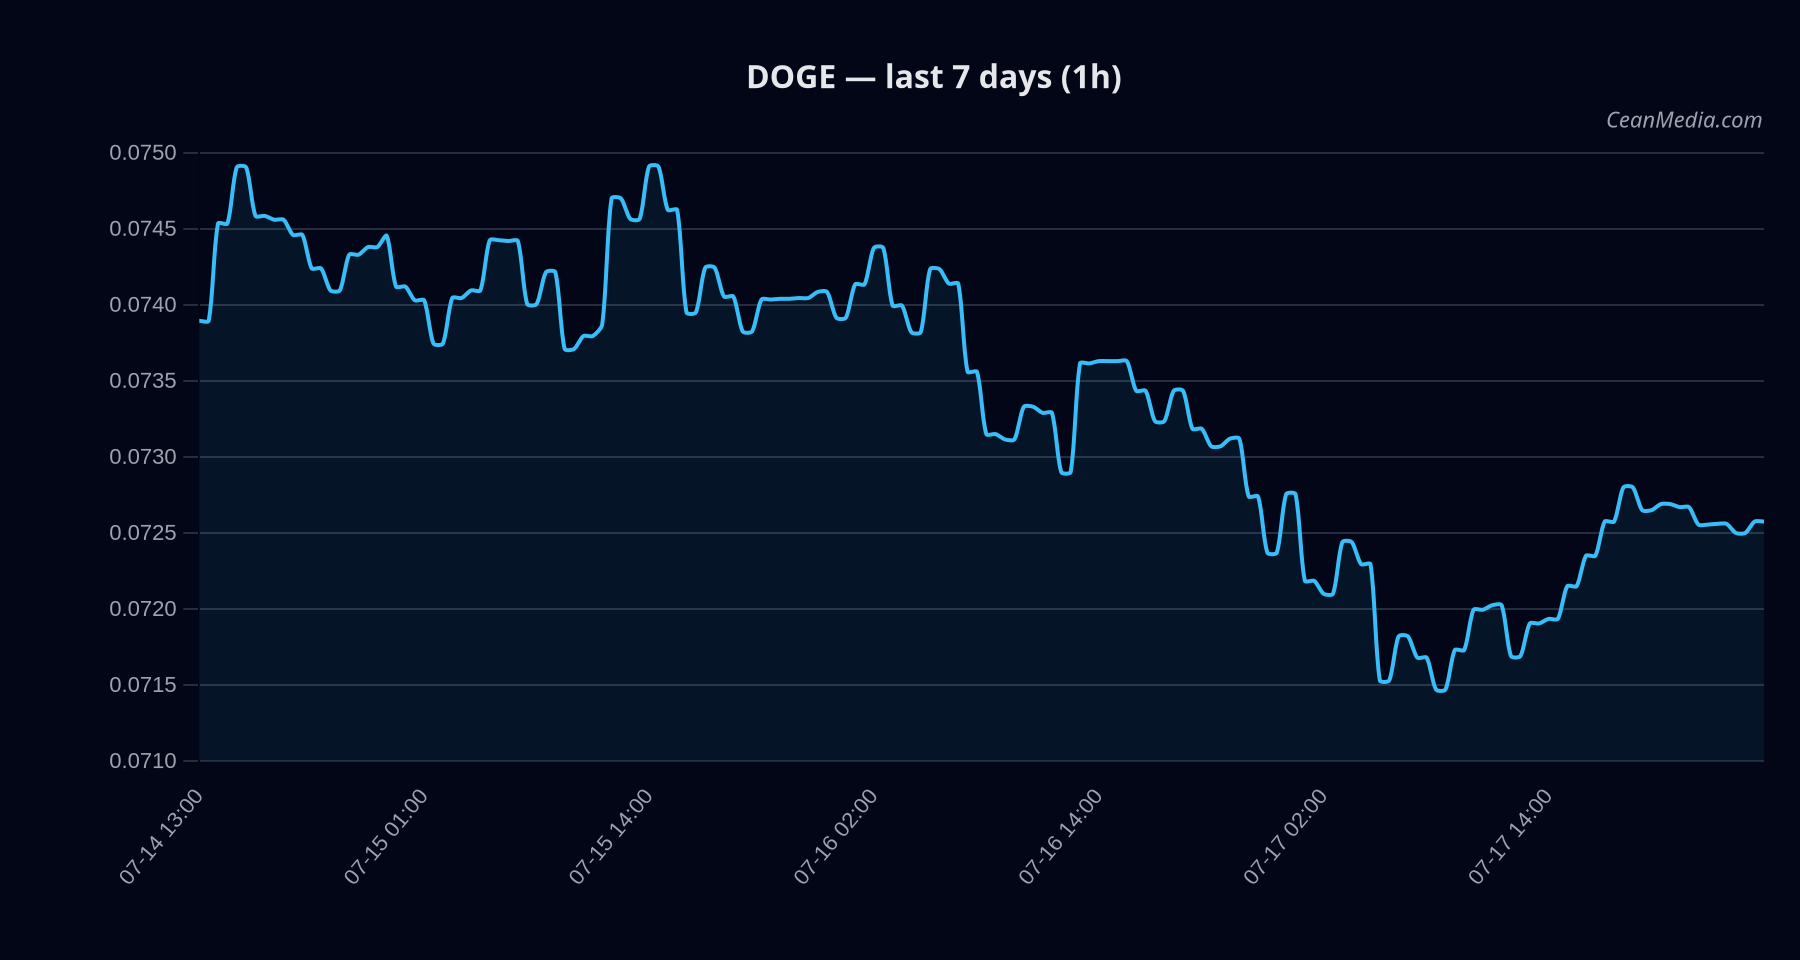
As of 2026-07-18, DOGE sits within a narrow trading range with little directional conviction. The immediate price is around 0.0727, basing between support near 0.071 and resistance near 0.074. Market breadth remains modest, and cross-asset risk appetite shows signs of weakness, consistent with a risk-off tone in broader markets despite a technically mixed setup for DOGE.
Technical Analysis: DOGE
- Bias: Mixed / bearish pressure; certainty low (14/100).
- Composite Score: -1.9 with 1 conflict.
- Trend: TA trend is sideways; RSI at 55. EMA12>EMA26 and SMA50
- Forecast Range: P50 0.0727; P20-P80 ranges from 0.0686 to 0.0758.
- Key Levels:
- Support: near 0.071
- Major Support: 0.072
- Resistance: near 0.074
- Major Resistance: 0.077
- Triggers:
- Up: 1h close > 0.074 → target 0.0757–0.0772
- Down: 1h close < 0.071 → target 0.0699–0.0684
- Invalidation Notes: Data is currently showing misalignment across signals; treat direction as not high-conviction until trigger confirmation.
Drivers
- Top Model Drivers (contributions):
- SPREAD BP: -2.78 (value 7.14)
- FNG Z-SCORE: +1.71 (value 6.28)
- STABLE MCAP LOG1P: +0.64 (value -1.92)
- TBI EMA10: -0.57 (value -2.08)
- CROSS ASSET RISK Z-SCORE: +0.57 (value -0.52)
- LIQ IMB Z-SCORE: +0.55 (value -3.71)
- Momentum & Volatility: Overall momentum readings around neutral to modestly negative; vol regime described as very low, with current breadth indicating limited participation above moving averages.
ETF Flows (BTC/ETH)
Contextual note: ETF flow data provided here pertains only to BTC and ETH and should be considered a macro context rather than a direct signal for DOGE. Recent BTC ETF flows show a small positive intraday change, while ETH ETF flows are negative over the latest period. These flows can influence risk sentiment and liquidity dynamics in multi-asset markets, but DOGE-specific signals should rely primarily on its own technicals and micro-structure data.
- BTC ETF: +$15.0M (1D); -$324.2M (5D); -$1.65B (10D)
- ETH ETF: -$16.8M (1D); +$6.8M (5D); -$214.7M (10D)
What to Watch Next
- Monitor 1h close relative to 0.074 for potential near-term upside targeting 0.0757–0.0772.
- Watch for a break below 0.071 to assess downside momentum toward 0.0699–0.0684.
- Assess changes in market breadth and cross-asset risk signals as DOGE remains in a low-volatility regime.
- Reconcile any alignment between price action and model drivers, given the current misalignment warning.
Hashtags: #Dogecoin #CryptoTechnical #MarketAnalysis #BTCFlows #ETHFlows #Altcoins #TechnicalAnalysis #MarketStructure #RiskOnOff #Liquidity #CryptoNews #TradingStrategy