
Market Snapshot
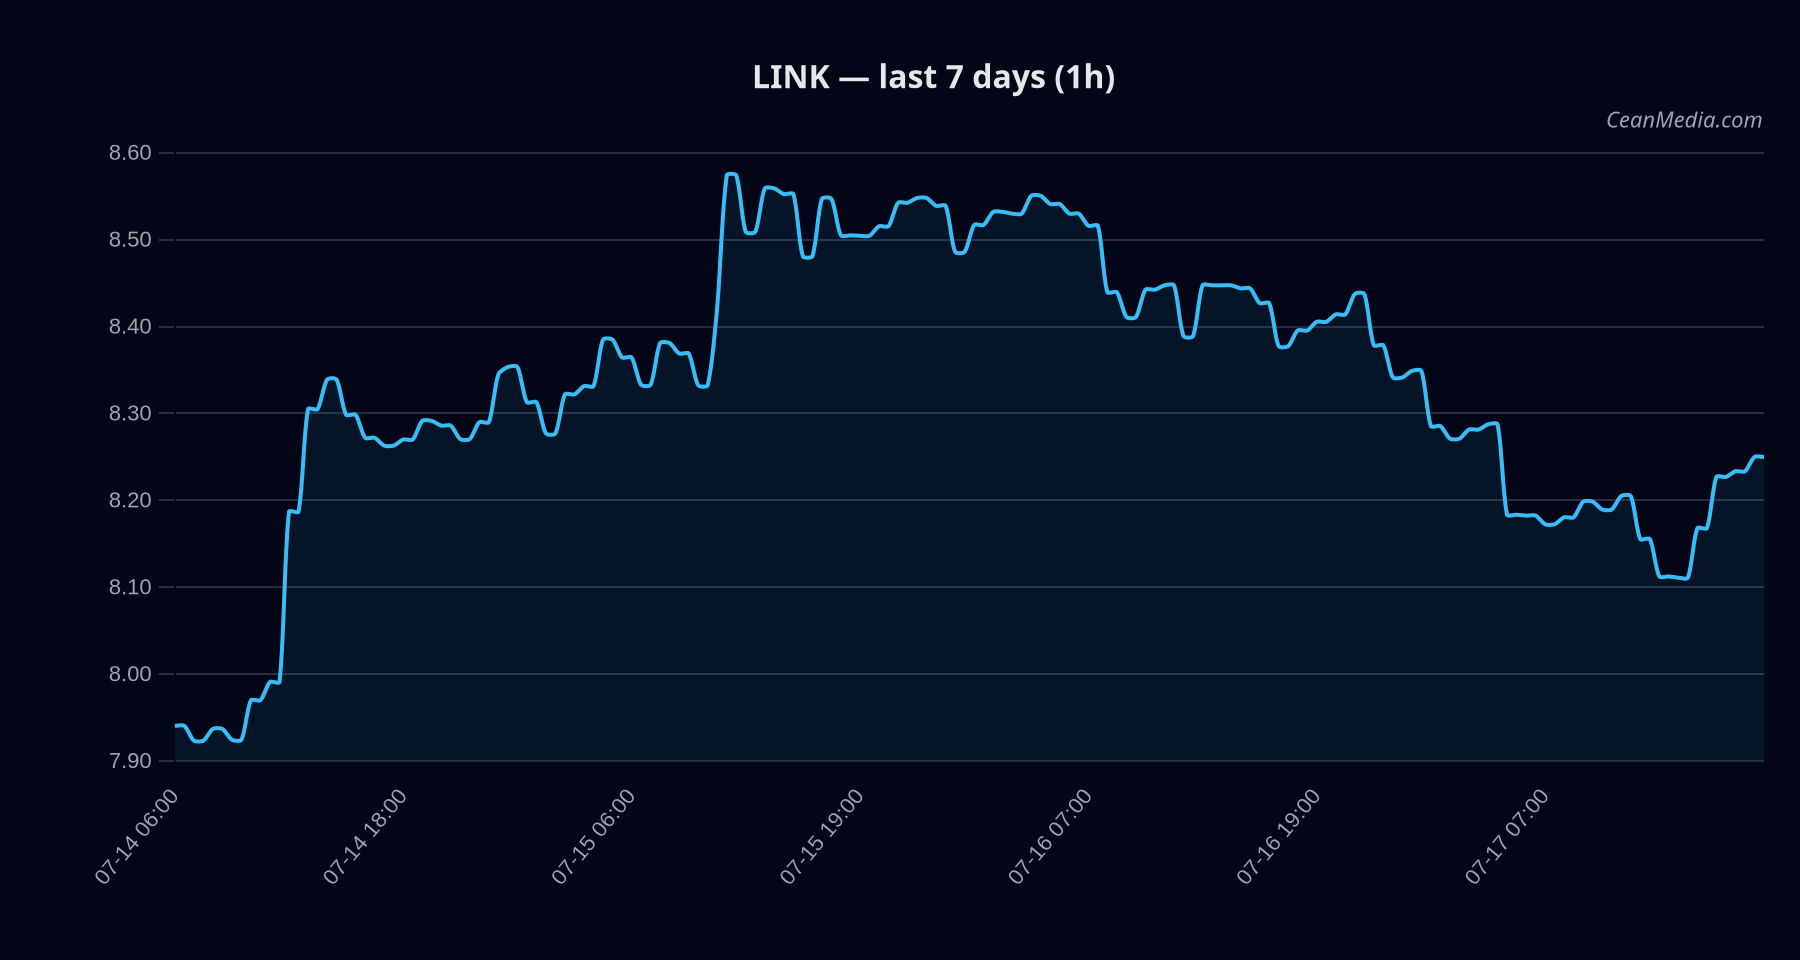
As of 2026-07-17 close, LINK is trading around 8.25 with a very low volatility regime. The model assigns a bearish bias with low certainty (39/100), reflecting mixed momentum indicators and a sideways technical posture despite a forecast range that tilts toward upside in the near term. Market breadth is modest, and macro signals show risk assets remaining softer, with fear sentiment around 27 and BTC dominance trending higher over a 7-day window.
Technical Analysis: LINK
-2.7 sideways; RSI 49 EMA12
Forecast range and levels: LINK sits between support near 8.08 and resistance near 8.42. A break above 8.42 targets 8.5843–8.7527. A break below 8.08 targets 7.9243–7.7625.
Triggers:
- Upside: 1h close > 8.42 → 8.5843 / 8.7527
- Downside: 1h close < 8.08 → 7.9243 / 7.7625
Note: The forecast probability for a near-term move is skewed toward upside (48%), but the overall bias remains bearish with a narrow trading range in the current regime.
Drivers
Return 24h (-0.02), EMA slope (0.0009), Funding Z-score (-0.54), Basis Z-score (-0.37), OB-EMA5 (-0.0017), BTC return 24h (0.0003) Very low volatility regime; trend strength modest (0.78) with distance from MA near -0.44% Cross-market risk assets soft; fear sentiment 27; BTC dominance up modestly (0.16 over 7D)
Overall, the drivers indicate limited momentum with modest downside triggers and a narrow upside potential as conditions permit a break above key resistance.
ETF Flows (BTC/ETH)
Context: ETF flow data referenced here is for BTC and ETH only. These flows provide macro context but are not a primary signal for LINK performance. Recent data show BTC ETFs +$15.0M on the day, with longer-term flows negative (-$324.2M over 5D) and 10D net negative (-$1.65B). ETH ETFs show opposite orientation: +$0? on 1D (shown as -$16.8M in the table) with 5D +$6.8M and 10D -$214.7M. The headline interpretation is that near-term risk-on/risk-off sentiment is influenced by crypto-wide ETF activity, particularly BTC, which can set a broader risk backdrop.
Interpretation: The BTC ETF flow is positive on the immediate term, suggesting some liquidity support for crypto markets, while the longer-term frame shows substantial outflows, hinting at caution. ETH flows are mixed but lean toward outflows over longer horizons. This ETF context aligns with a cautious market tone that may constrain LINK’s upside unless price action breaks above defined resistance levels.
What to Watch Next
- Watch for a daily close above 8.42 to validate a potential near-term breakout toward 8.58–8.75.
- Monitor a daily close below 8.08 for confirmation of downside risk toward 7.92–7.76.
- Observe any shifts in BTC dominance and overall risk-appetite signals, as BTC flow dynamics can influence correlated altcoins.
- Keep an eye on macro sentiment indicators and volatility regime shifts that could compress or expand LINK’s trading range.
Hashtags: #LinkAnalysis #CryptoMarkets #TechnicalAnalysis #ETFFlows #Bitcoin #Altcoins #MarketSnapshot #TradingStrategy #RiskManagement #Momentum