
Market Snapshot
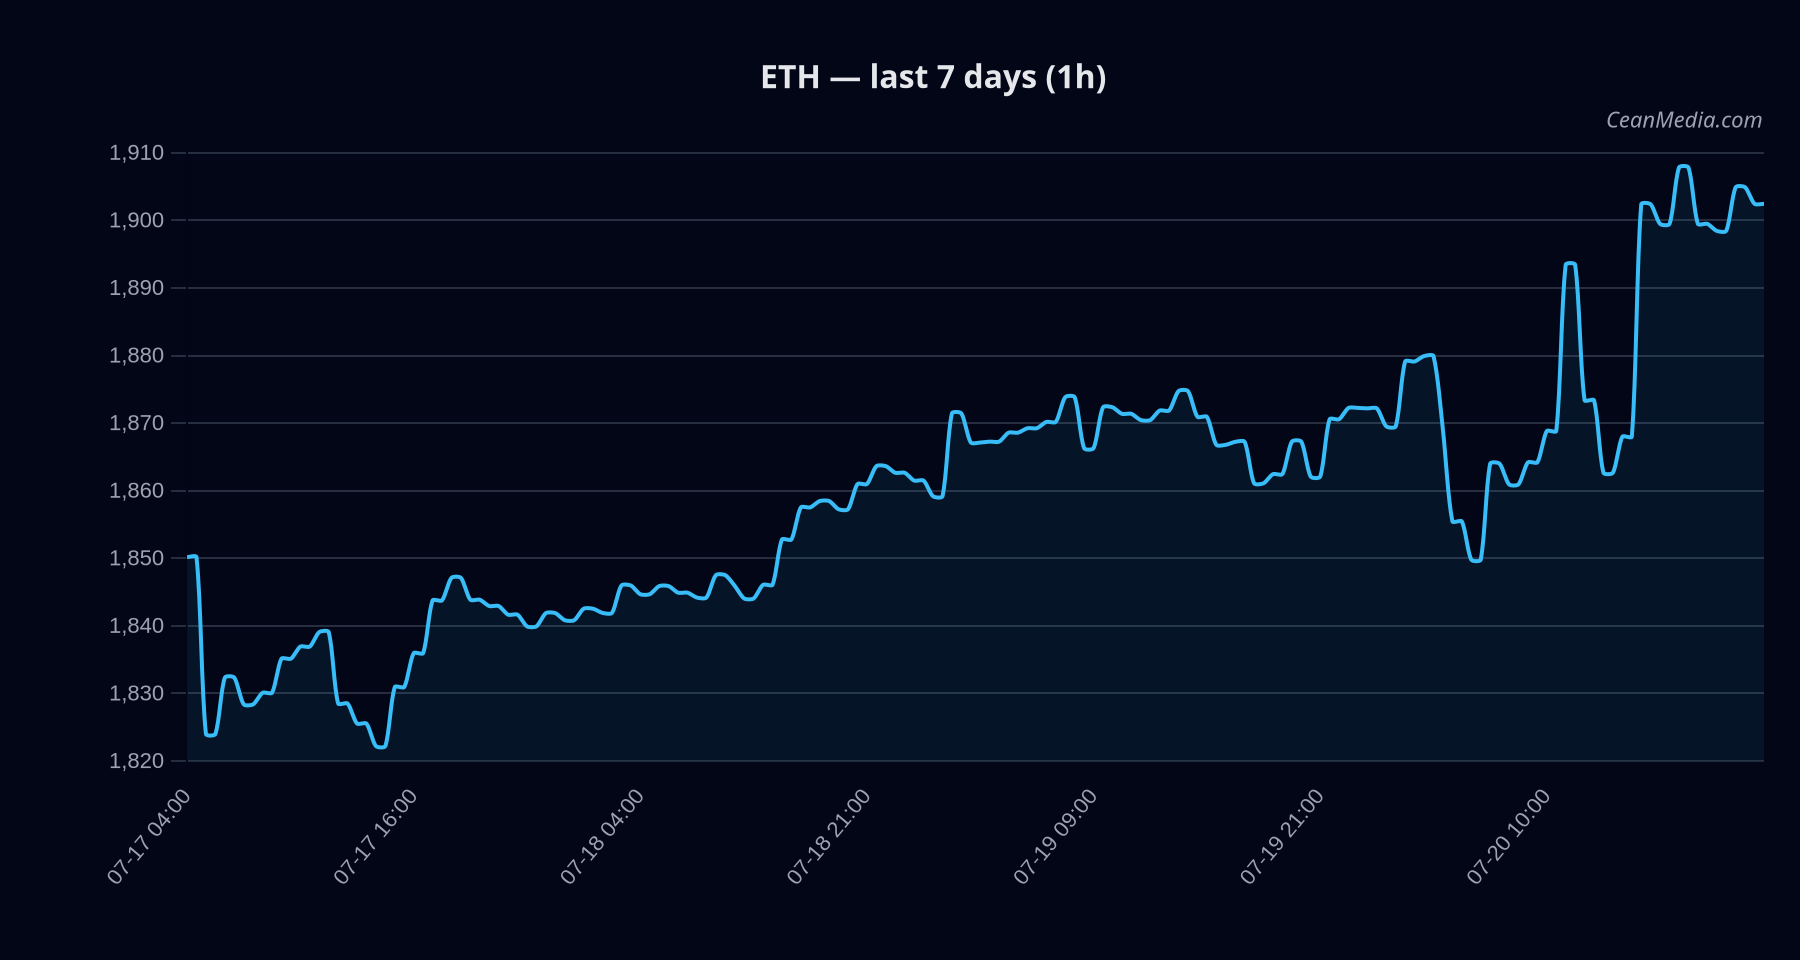
As of 2026-07-20, ETH traded around the 1,895.93 area with a very low volatility regime. Market breadth remained robust, and BTC showed a strong correlation (ρ BTC,72h ≈ 0.92). The composite view for ETH is mixed with bullish pressure but low conviction (certainty 8/100), reflecting data that is not fully aligned. The price sits between defined support and resistance levels, suggesting a cautious stance until a confirmed breakout or breakdown occurs.
Technical Analysis: ETH
- Bias and Trend: Mixed/bullish pressure with low certainty. TA trend is bullish (EMA12 > EMA26; SMA50 > SMA200; RSI 57). Volatility regime described as very low.
- Key Levels:
- Support: 1,858 (near) with major support at 1,752
- Resistance: 1,934 (near) with major resistance at 1,882
- Forecast Range: P50 around 1,890.87; P20-P80 range 1,819.61 – 2,024.66
- Triggers:
- Up trigger: close > 1,934 → potential move toward 1,972.53 – 2,011.20
- Down trigger: close < 1,858 → potential move toward 1,820.85 – 1,783.69
- Momentum and Volatility: Vol regime very low; σ24h ≈ 0.63% (low dispersion). BTC dominance rising modestly and BTC 72h correlation remains high, reinforcing cross-market sensitivity.
- Interpretation: The current setup indicates a range-bound environment with a potential breakout bias to the upside if 1,934 gives way to sustained closes above resistance. Invalidation would be a move below 1,858 with sustained pressure.
Drivers
- RETURN 24H: small positive tailwind
- EMA Slope: mild bullish slope
- FUNDING Z-SCORE: negative contribution indicating slight funding pressure
- BASIS Z-SCORE: negative contribution
- ORDER-BOOK IMBALANCE (EMA5): negative contribution
- BTC RETURN 24H: modest positive correlation
Cross-market risk assets showing softness; Fear index sub-30; BTC dominance trending higher over 7 days, contributing to ETH’s intra-day pressure dynamics. Volatility is currently very low; breadth signals are supportive, with BTC and alt-breadth readings indicating a generally constructive environment without strong directional conviction.
ETF Flows (BTC/ETH)
The ETF flow data provided covers BTC/ETH tickers and is intended to provide contextual positioning rather than a primary signal for ETH trades. The BTC ETF shows +$132.3M for 1D, while ETH ETF shows +$36.7M for 1D, with longer-horizon frames reflecting net outflows in certain windows. Overall, ETF data suggests a risk-on tilt in certain BTC instruments, but ETH-specific flows are modest and should not be treated as a standalone driver for ETH moves.
+$132.3M; 5D: -$393.5M; 10D: -$1.39B +$36.7M; 5D: +$11.6M; 10D: -$123.1M
Implication: The data reflects broader risk-on/off sentiment rather than a pure ETH-led signal. Investors should weigh ETF flows as context alongside price action, not as primary drivers for ETH decisions.
What to Watch Next
- Monitor for a close above 1,934 to target higher levels (potential 1,972.53–2,011.20).
- Watch for a break below 1,858 to assess downside risk toward 1,820.85–1,783.69.
- Maintain attention on BTC performance and cross-asset risk appetite, given the high BTC-ETH correlation.
- Keep an eye on ETF flow shifts as supplementary context for risk sentiment, not as ETH-specific signals.
Hashtags: #ETHAnalytics #ETHTechnical #MarketSnapshot #ETFFlows #CryptoMarkets #BTCETHCorrelation #TradingStrategy #RiskManagement #LiquidityWatch #MarketContext #PriceAction #TechnicalAnalysis