
Market Snapshot
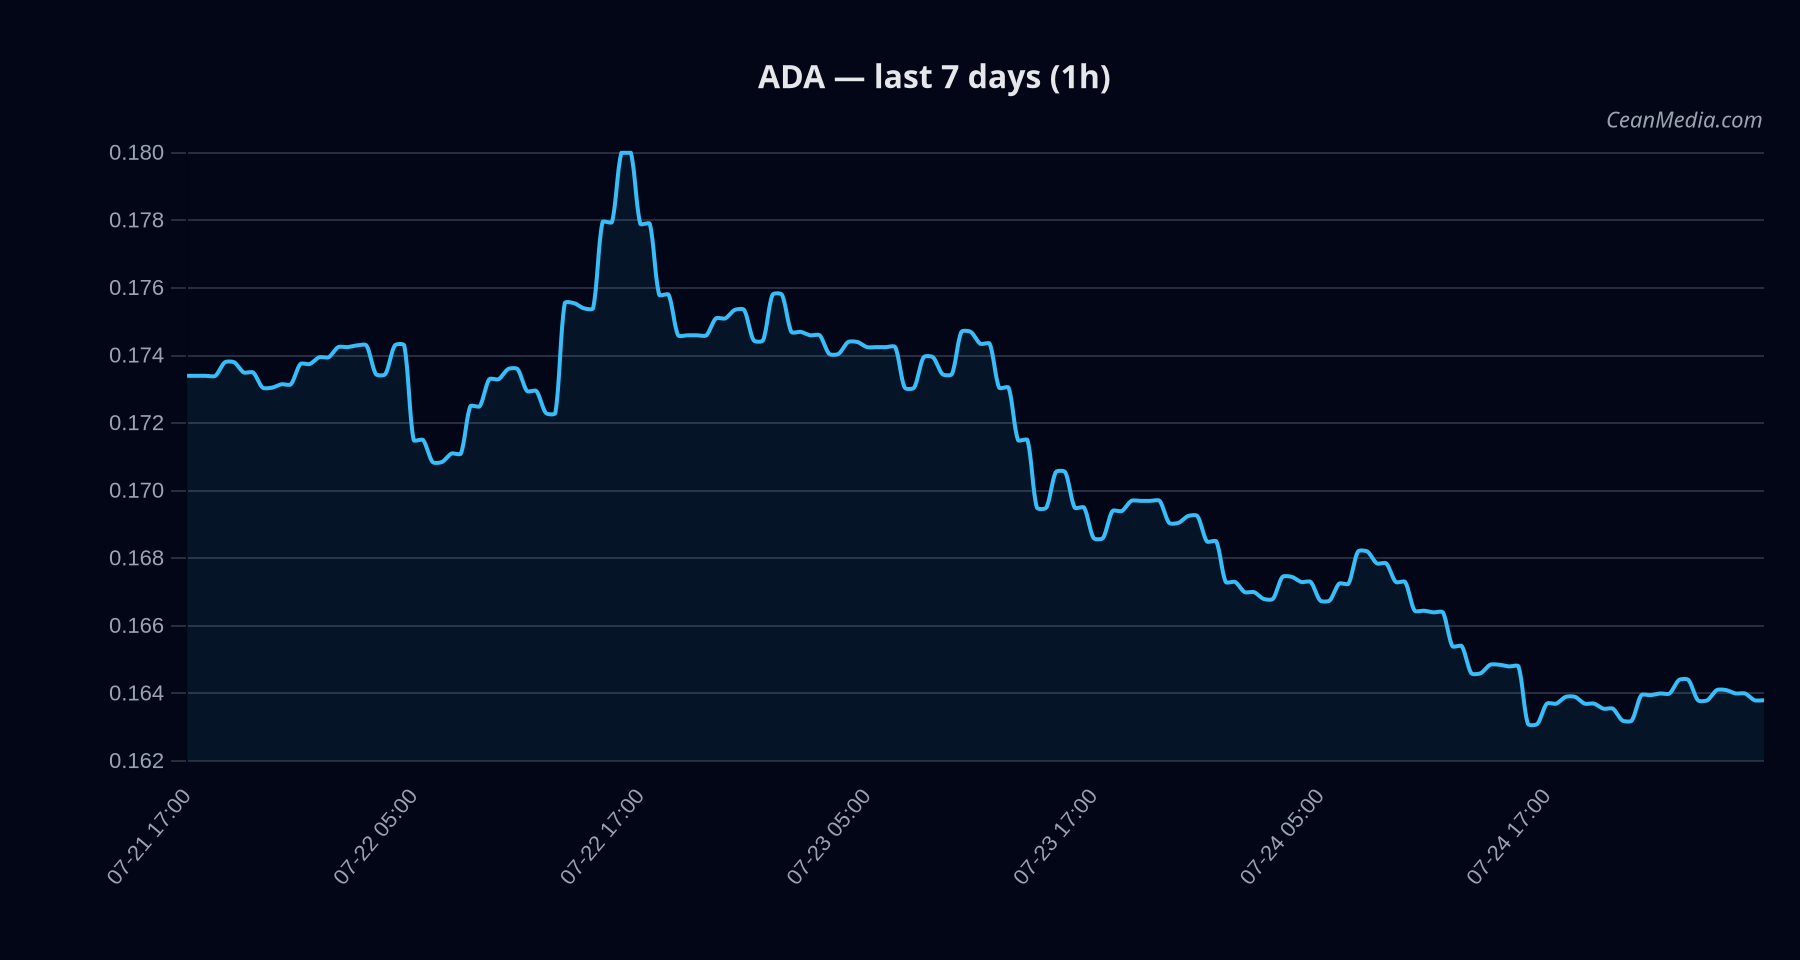
As of 2026-07-25, ADA opens a nuanced window with a price near 0.163 and a technically mixed backdrop. The bias is described as slightly bearish with a low confidence level. Macro and cross-market context show risk assets softening and a very low volatility regime, which constrains breakout momentum.
Technical Analysis: ADA
TA trend is sideways. RSI at 32 indicates possible oversold conditions, but current momentum is muted. EMA12 < EMA26 and SMA50 > SMA200 support a range-bound view. Volatility is very low (σ24h 0.38%), reinforcing a lack of directional pressure. - Support near 0.16; major support at 0.16
- Resistance near 0.165; major resistance at 0.175
- Upside trigger: 1h close above 0.165 targets 0.1695–0.1728
- Downside trigger: 1h close below 0.16 targets 0.1564–0.1533
Drivers
FNG Z-Score (positive contribution), followed by negative contributions from SPREAD BP and GOLD/Silver dynamics. BTC-related factors show modest negative influence for the 24h window. Volatility regime is very low; trend strength modest but present. Market breadth is weak, with a flat breadth reading and low SVOL signals suggesting subdued momentum. Cross-market risk assets remain soft. Fear index (F&G) sits around 27, indicating a cautious sentiment environment.
ETF Flows (BTC/ETH)
ETF flow context is provided for BTC and ETH and should be treated as contextual risk signals rather than primary drivers for ADA. BTC ETFs show a net negative flow on the 1D horizon, with a longer-term positive swing in 5D and negative in 10D. ETH ETFs show a small positive 1D flow, with larger positive signals over 5D and 10D. This pattern suggests cautious positioning in broader markets rather than a clear immediate risk-on rally.
What to Watch Next
- Monitor price action around 0.165 to assess upside breakout potential.
- Watch for a daily close below 0.16 for confirmation of further downside targeting 0.156–0.153.
- Confirm any shift in RSI away from oversold levels to indicate renewed upside momentum.
- Corroborate ADA signals with broader market risk-on/risk-off cues, while treating ETF BTC/ETH flows as contextual rather than primary signals for ADA.
Hashtags: #ADA #CryptoAnalysis #TechnicalAnalysis #MarketSnapshot #ETFFlows #BTC #ETH #RiskOn #RSI #EMA #SMA