
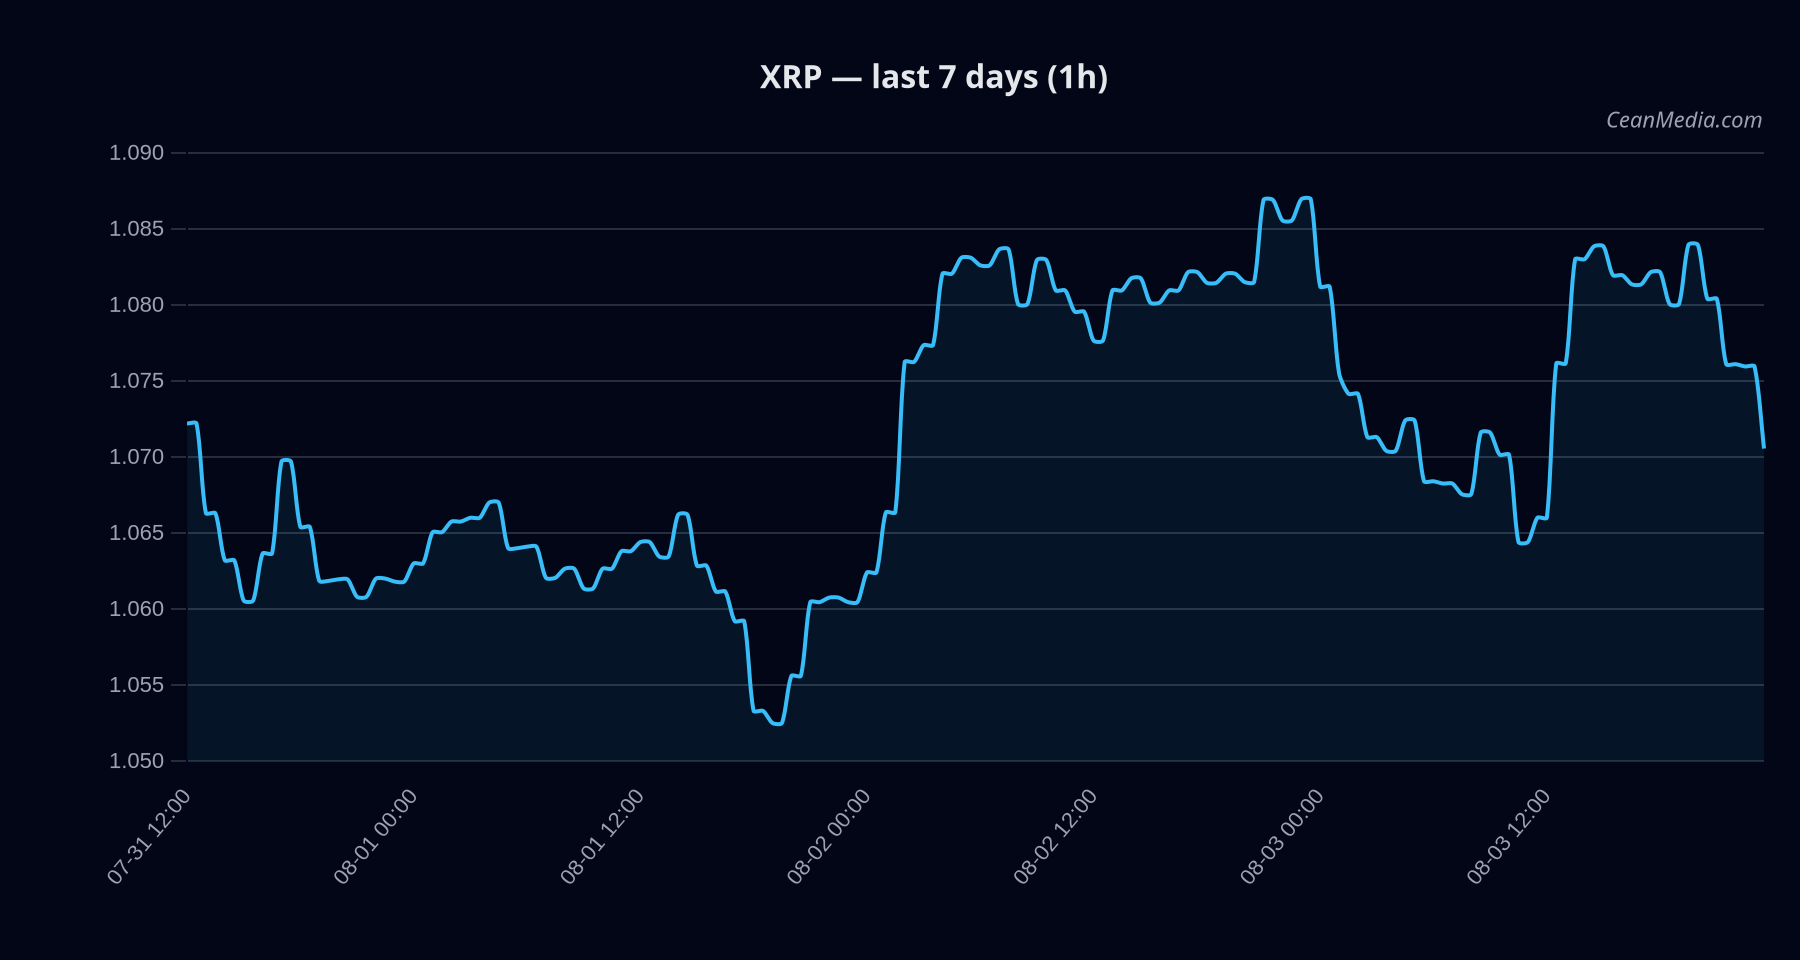
Market Snapshot
Asset: XRP | Close: 1.0716 | Model: sideways | Bias: mixed/neutral | Certainty: low (6/100). Forecast range: 1.0066 – 1.1262 with a P50 around 1.0717. Market breadth sits around 50% above the 50-day moving average; BTC correlation over 72 hours is 0.77. Price is trading between near-term support at 1.06 and resistance at 1.10, with a major resistance near 1.14 and support near 1.06.
Technical Analysis: XRP
- Trend: Sideways. RSI at 43 indicates neutral momentum. EMA12 > EMA26 and SMA50 > SMA200 supporting a range-bound view.
- Key Levels:
- Support: 1.06 (major 1.06)
- Resistance: 1.10 (major 1.14)
- Triggers:
- Upside trigger: 1h close > 1.10 could lead to targets 1.1149 and 1.1368
- Downside trigger: 1h close < 1.06 could lead to targets 1.0292 and 1.0082
- Forecast: Sideways with a probability split of up 44%, sideways 9%, down 46% for the next 24 hours. Trend strength is modest with very low volatility (σ24h 0.35%).
- Momentum/Volatility: Vol regime described as Very Low; breadth approximately 50% above SMA50; BTC correlation ~0.77 supporting a correlated but non-directional move across crypto assets.
Drivers
: - RV 7D: negative contribution
- DRAWDOWN 30D: positive contribution
- GOLD/SILVER ratio Z-score: positive signal
- SPREAD BP: negative contribution but higher absolute value
- STABLE MCAP LOG1P: positive contribution (risk-on factors)
- SP500 RET 5D: negative contribution
: Fearful sentiment (F&G index around 25); Stablecoin liquidity contracting slightly; price-driven by a mix of macro backdrop and cross-asset dynamics. Bitcoin dominance around 56%; BTC 24h return modestly positive but overall limited upside momentum.
ETF Flows (BTC/ETH)
Contextual data: ETF flow information is reported for BTC and ETH only and should be treated as secondary context for XRP analysis. The flows indicate risk-on/off dispositions in the broader market environment but are not a direct signal for XRP pricing.
- BTC ETF: 1D -$265.4M; 5D -$244.9M; 10D -$305.5M
- ETH ETF: 1D +$9.0M; 5D -$6.2M; 10D +$96.3M
Interpretation: Persistent outflows in BTC ETFs over multiple horizons may reflect shifting risk appetite or profit-taking in a high-beta environment. ETH ETF data shows mixed signals with a small near-term inflow; however, ETF trends are not a primary signal for XRP price and should be considered as macro-contextual input for risk sentiment, liquidity considerations, and correlation expectations.
What to Watch Next
- Monitor 1h close relative to 1.10 for potential breakout toward 1.1149–1.1368 if breached.
- Watch for a break of 1.06 to assess downside risk toward 1.0292–1.0082.
- Assess changes in volatility regime and RSI movement beyond 45–50 as confirmation of momentum shifts.
- Keep an eye on BTC/ETH ETF flow shifts as an indirect gauge of risk appetite, even though XRP is not driven by ETF data.
Hashtags: #XRPanalysis #CryptoTrading #TechnicalAnalysis #MarketSnapshot #ETFFlows #BTC #ETH #CryptoMarkets #RiskOn #RiskOff #Liquidity #MarketSentiment