Market Snapshot
As of January 2, 2026, Bitcoin (BTC) is trading near key support levels with cautious technical signals. The overall market sentiment reflects low volatility and a neutral to slightly bearish bias, amid significant ETF outflows in both BTC and ETH segments over the past week.
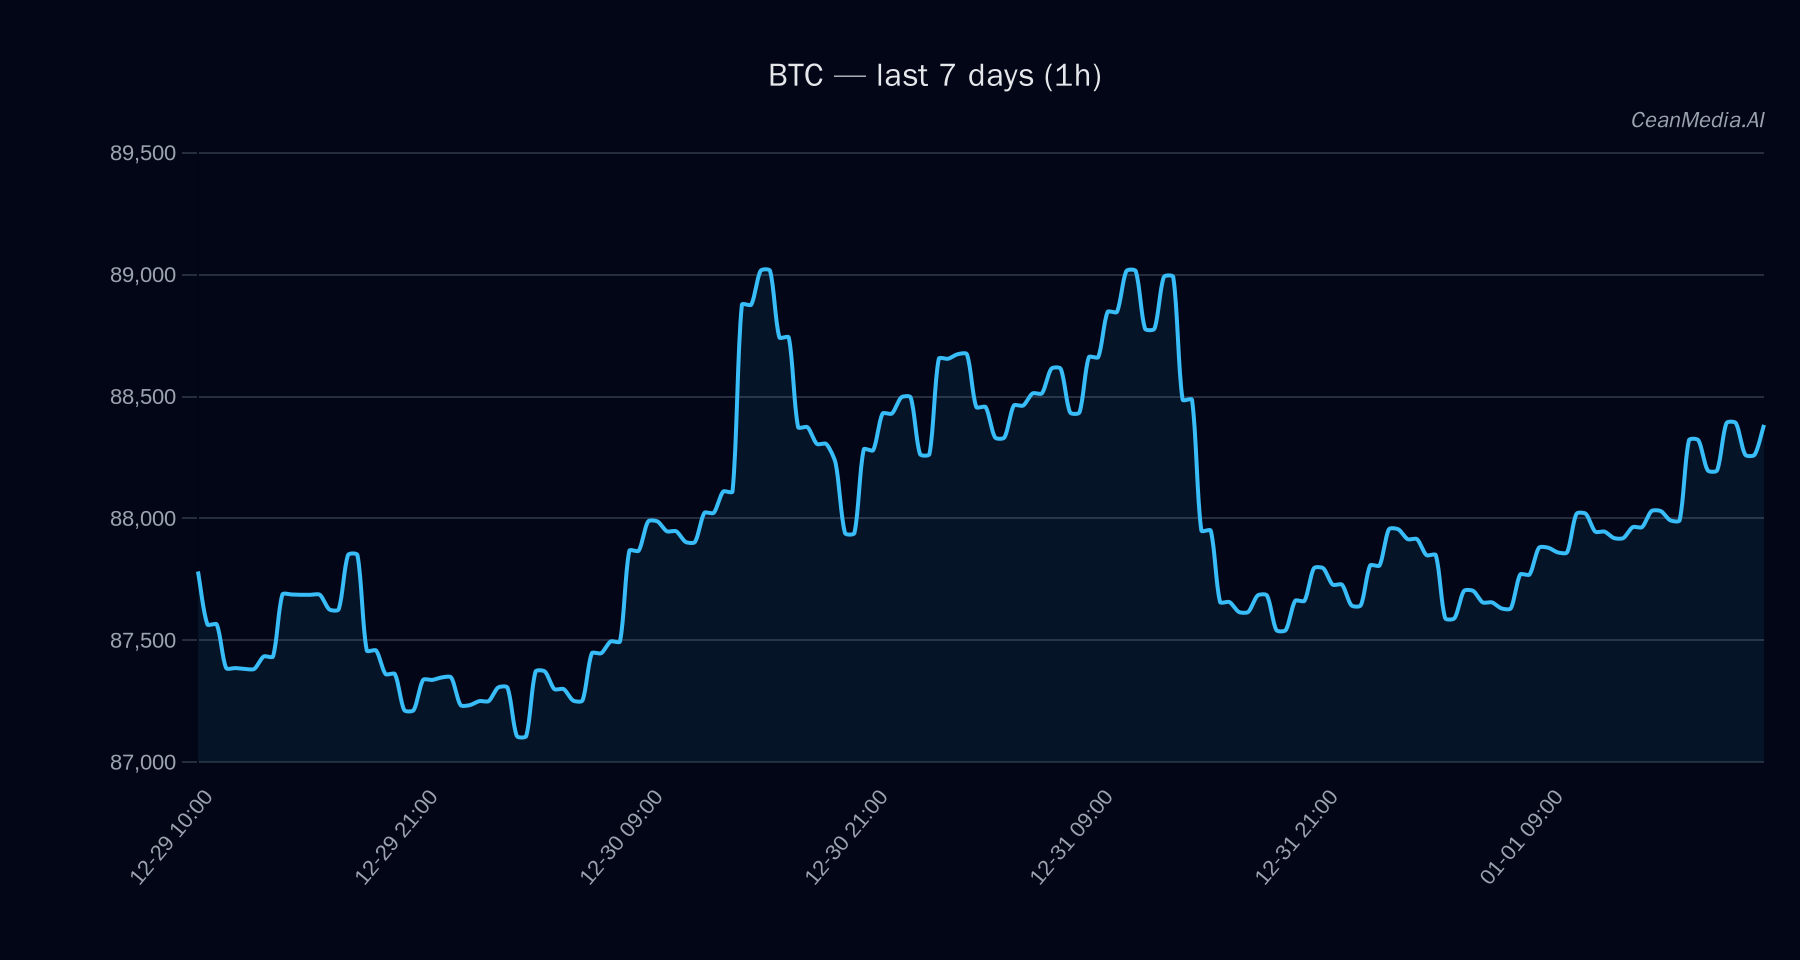
Technical Analysis: BTC
Current Price: $88,574.77
- Support levels: Major support at $87,300, near support at $86,800
- Resistance levels: Major resistance at $88,900, near resistance at $90,350
- Breakout targets: Break above $90,350 could target $92,153 to $93,960
- Downside targets: Break below $86,800 could see prices decline to $85,067 or lower to $83,331
Technical indicators show a bullish trend with EMA12 above EMA26, and SMA50 above SMA200, RSI at 64 indicating neutral momentum. The short-term forecast leans towards a downward move with a 47% confidence, but the overall bias remains cautious given low volatility and market breadth.
Drivers
- Return 24H: +0.57%
- EMA slope: Slight upward slope at 0.0003
- Funding Z-Score: -1.11 (indicating slight bearish funding sentiment)
- Basis Z-Score: 1.38 (positive basis suggesting potential bullishness)
- Order Book Imbalance (EMA5): 0.09 (indicating minor imbalance favoring buy orders)
- Trend Strength: 1.05, supporting a mildly bullish momentum
Market breadth remains above 50 at 83%, with a 100% altcoin breadth excluding mega caps, but volatility regime remains very low, suggesting subdued trading activity. The Fear & Greed index shows ‘Extreme Fear’, reflecting cautious investor sentiment.
ETF Flows (BTC/ETH)
Over the past five days, Bitcoin ETFs have experienced substantial outflows totaling approximately $423 million, with daily outflows around $85 million. Ethereum ETFs also saw notable outflows of about $71 million in the same period. These persistent outflows indicate a risk-off environment, with investors withdrawing from crypto-based ETFs, possibly reflecting broader market uncertainty. It is important to note that ETF flows are only a contextual factor for BTC and ETH and should not be solely relied upon for trading decisions.
What to Watch Next
- Monitor the price action around key support at $86,800 and resistance at $90,350.
- Watch for a breakout confirmation above $90,350 or a breakdown below $86,800 for directional bias.
- Keep an eye on ETF flow trends and broader risk sentiment, especially in relation to macroeconomic developments.
- Observe the evolving technical momentum indicators for signs of trend acceleration or reversal.
Note: ETF flow data is specific to BTC and ETH and provides contextual market sentiment rather than primary trading signals.
Hashtags: #Bitcoin #CryptoAnalysis #ETFFlows #MarketUpdate #TechnicalAnalysis #CryptoTrends #BTC #ETH #RiskOff #MarketSentiment #CryptoNews #InvestmentStrategy