Market Snapshot
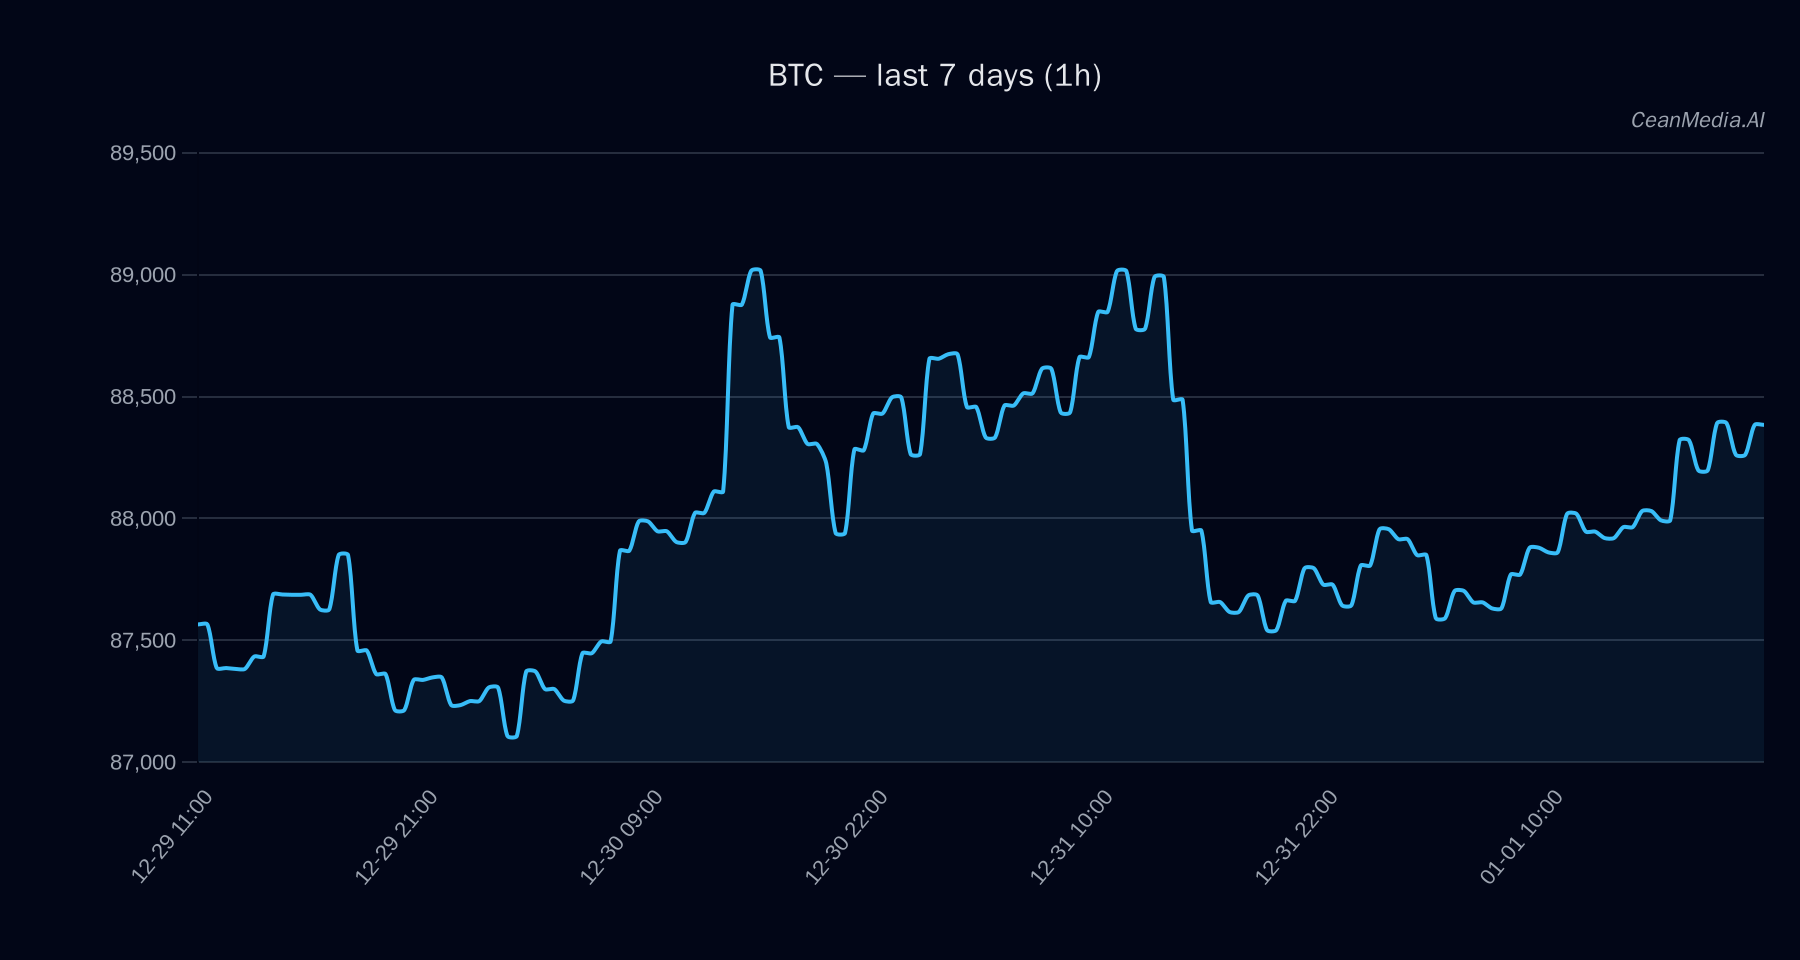
As of January 2, 2026, Bitcoin (BTC) trades around $88,472 with a neutral to slightly bearish short-term outlook. Market sentiment remains cautious amid low volatility regimes, with recent ETF flows indicating sustained outflows from BTC and ETH funds over the past week.
Technical Analysis: BTC
Bitcoin is currently trading between key support at approximately $86,700 and resistance near $90,250. A break above resistance could target levels around $92,047 to $93,852, while a decline below support may see prices fall to approximately $84,969 to $83,235. The technical bias is bullish, supported by moving averages (EMA12 > EMA26, SMA50 > SMA200) and an RSI at 62, indicating neutral momentum. The probability of a short-term downward move stands at approximately 46%, with key levels for invalidation and confirmation outlined below:
- Upside Trigger: Close above $90,250, targeting $92,047–$93,852
- Downside Trigger: Close below $86,700, targeting $84,969–$83,235
Drivers
Top drivers influencing Bitcoin’s recent price movements include a modest 0.57% return over the past 24 hours, a slight positive EMA slope, and a trend strength index of approximately 1.05. Market sentiment remains cautious with a Funding Z-Score of -1.1 and a Basis Z-Score of -1.16, indicative of slight bearish pressures. The order book imbalance remains minimal, suggesting limited immediate directional conviction. Volume regimes are very low, reflecting subdued trading activity. Overall, technical momentum remains neutral with no significant volatility spikes.
ETF Flows (BTC/ETH)
Recent ETF flow data reveals persistent outflows from both Bitcoin and Ethereum ETFs, with BTC ETFs experiencing a total outflow of approximately $423 million over the past five days, and ETH ETFs declining by about $71 million in the same period. These flows suggest a risk-off sentiment among institutional investors, although the primary technical picture for BTC remains largely intact. It is important to note that ETF flows are only a contextual indicator and should not be solely relied upon for trading decisions.
What to Watch Next
- Monitor for a decisive break above $90,250 or below $86,700 to confirm directional bias.
- Observe changes in ETF flows, especially if outflows accelerate or reverse, for potential market sentiment shifts.
- Keep an eye on volatility regimes and volume activity for signs of increased trader engagement.
- Watch for macroeconomic developments or regulatory news that could impact institutional risk appetite.
Note: ETF flow data pertains only to BTC and ETH and is provided as contextual background rather than a primary trading signal.
Hashtags: #Bitcoin #CryptoAnalysis #BTC #MarketUpdate #CryptoFlows #TechnicalAnalysis #CryptoNews #Investing #Blockchain #DigitalAssets #CryptoTrading #FinancialMarkets