Market Snapshot
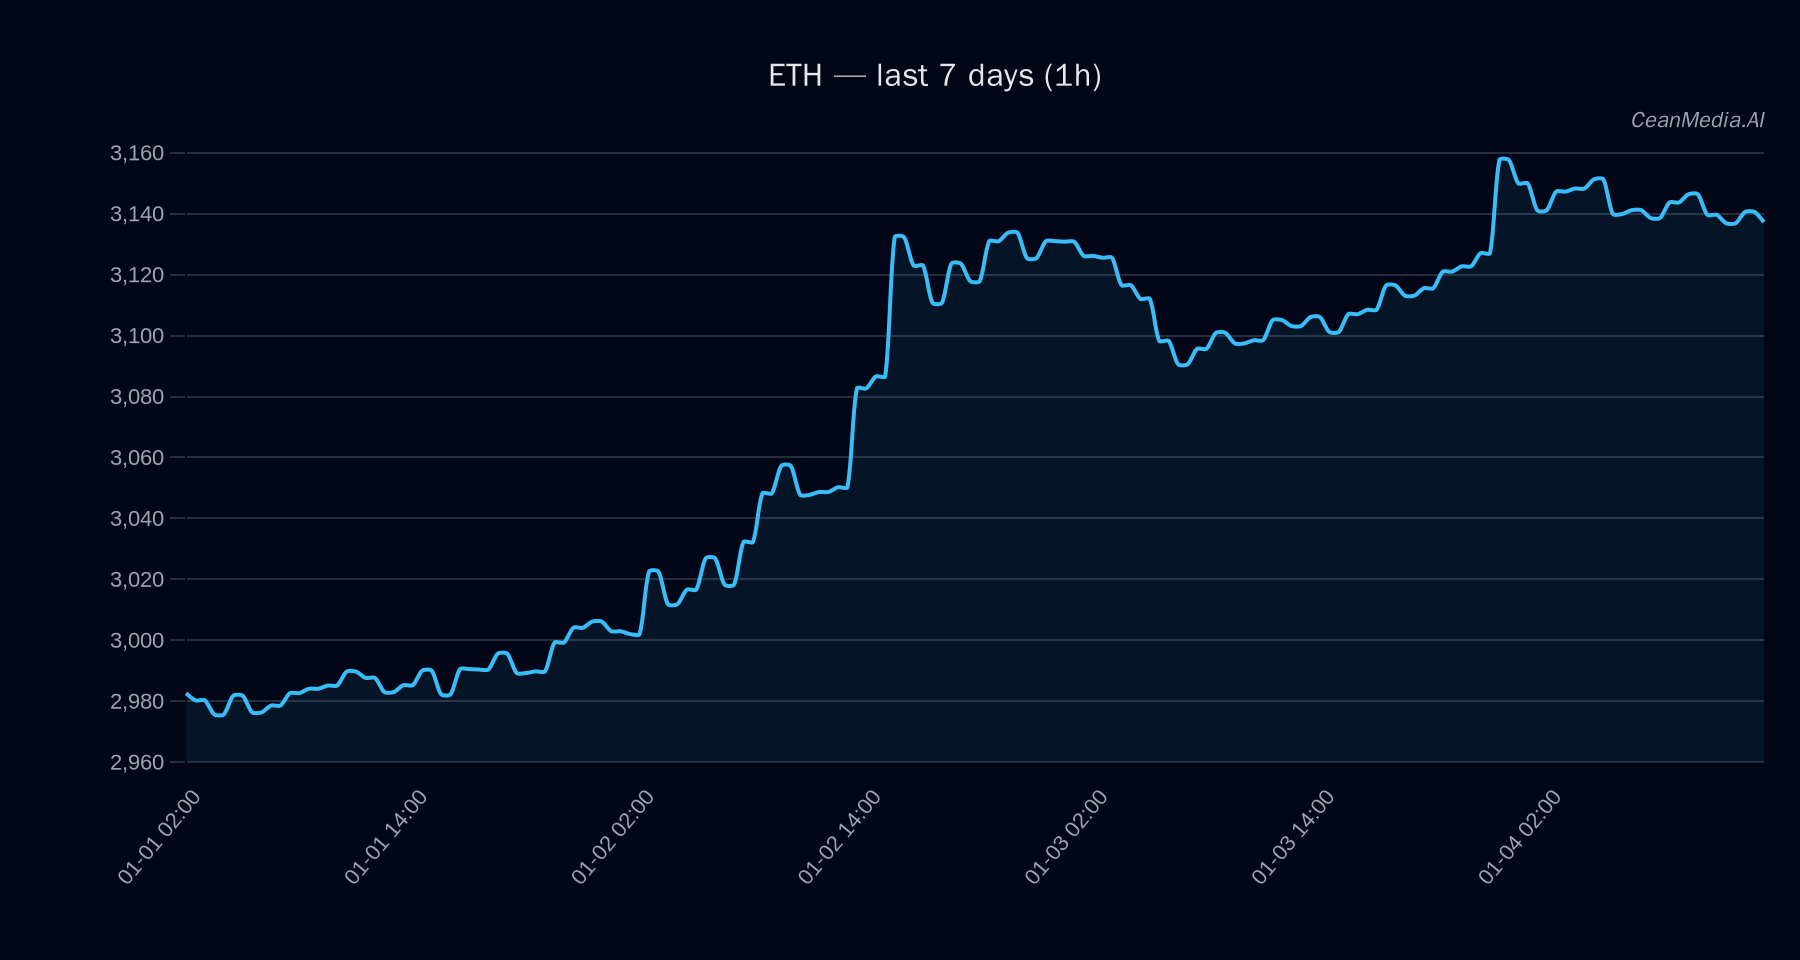
As of January 4, 2026, Ethereum (ETH) is trading around $3,138, with a neutral short-term outlook. Market sentiment remains cautious, with very low volatility and a balanced driver landscape. ETF flows indicate a mixed but slightly risk-on environment for both Bitcoin and ETH, contributing context to the broader crypto market dynamics.
Technical Analysis: ETH
- Levels: Support at approximately $3,076, resistance near $3,200. Break above $3,200 targets $3,264–$3,329. A decline below $3,076 could lead to prices around $3,014–$2,952.
- Bias: Bullish with a 45% probability of upward movement in the near term. The technical indicators (EMA12 > EMA26, SMA50 > SMA200, RSI at 55) support a neutral-to-bullish stance.
- Triggers: A decisive close above $3,200 could accelerate gains toward $3,328. Conversely, a close below $3,076 may signal potential downside to $2,953.
- Invalidation: The primary invalidation point is a daily close below $3,076, which would negate the bullish outlook.
Drivers
- Top Factors: The 24-hour return remains near zero (-0.3%), indicating a sideways momentum. The EMA slope is flat, and funding and basis Z-scores are modest, reflecting a balanced market environment.
- Momentum & Volatility: Market volatility remains very low (σ24h 0.25%), with no significant trend strength or trend divergence observed. The BTC correlation over 72 hours is high at 0.86, suggesting synchronized movements with Bitcoin.
- Additional Indicators: ETH ETF flows show positive inflows (+$174.5M over 1D and +$118.4M over 5D), indicating investor interest, while overall market sentiment remains cautious with an Extreme Fear index at 25.
ETF Flows (BTC/ETH)
Current ETF flows reveal a nuanced picture: Bitcoin ETFs have experienced recent inflows, especially over the 1-day period (+$471.3M), while ETH ETF flows are also positive (+$174.5M). Over the longer 10-day horizon, both assets have seen outflows, but ETH maintains a net inflow. This suggests a cautious risk-on environment, with investors showing interest in both assets but with a slight preference for ETH in the short term. It’s important to note that these flows are only contextual; they are not primary signals for ETH’s immediate price direction.
What to Watch Next
- Monitor the 1-hour and daily closes around key levels ($3,076 support and $3,200 resistance) for potential breakout or breakdown signals.
- Observe the upcoming shifts in ETF inflows and broader market sentiment indicators to gauge risk appetite.
- Watch for changes in market volatility and trend strength to anticipate possible trend reversals or acceleration.
- Stay alert to macroeconomic developments and crypto-specific news that could influence investor sentiment and liquidity.
Hashtags: #Ethereum #CryptoAnalysis #BTC #MarketTrends #ETFFlows #CryptoInvesting #Blockchain #DigitalAssets #CryptoNews #MarketStrategy