Market Snapshot
On January 5, 2026, Solana (SOL) is trading around $135.57, exhibiting a bullish technical stance with a short-term probability of upward movement at approximately 48%. Market breadth remains strong, with a 100% breadth indicator over 50 hours and a high correlation with Bitcoin over the past 72 hours (ρ 0.81). The overall market sentiment suggests cautious optimism, supported by very low volatility regimes and a neutral RSI at 56.
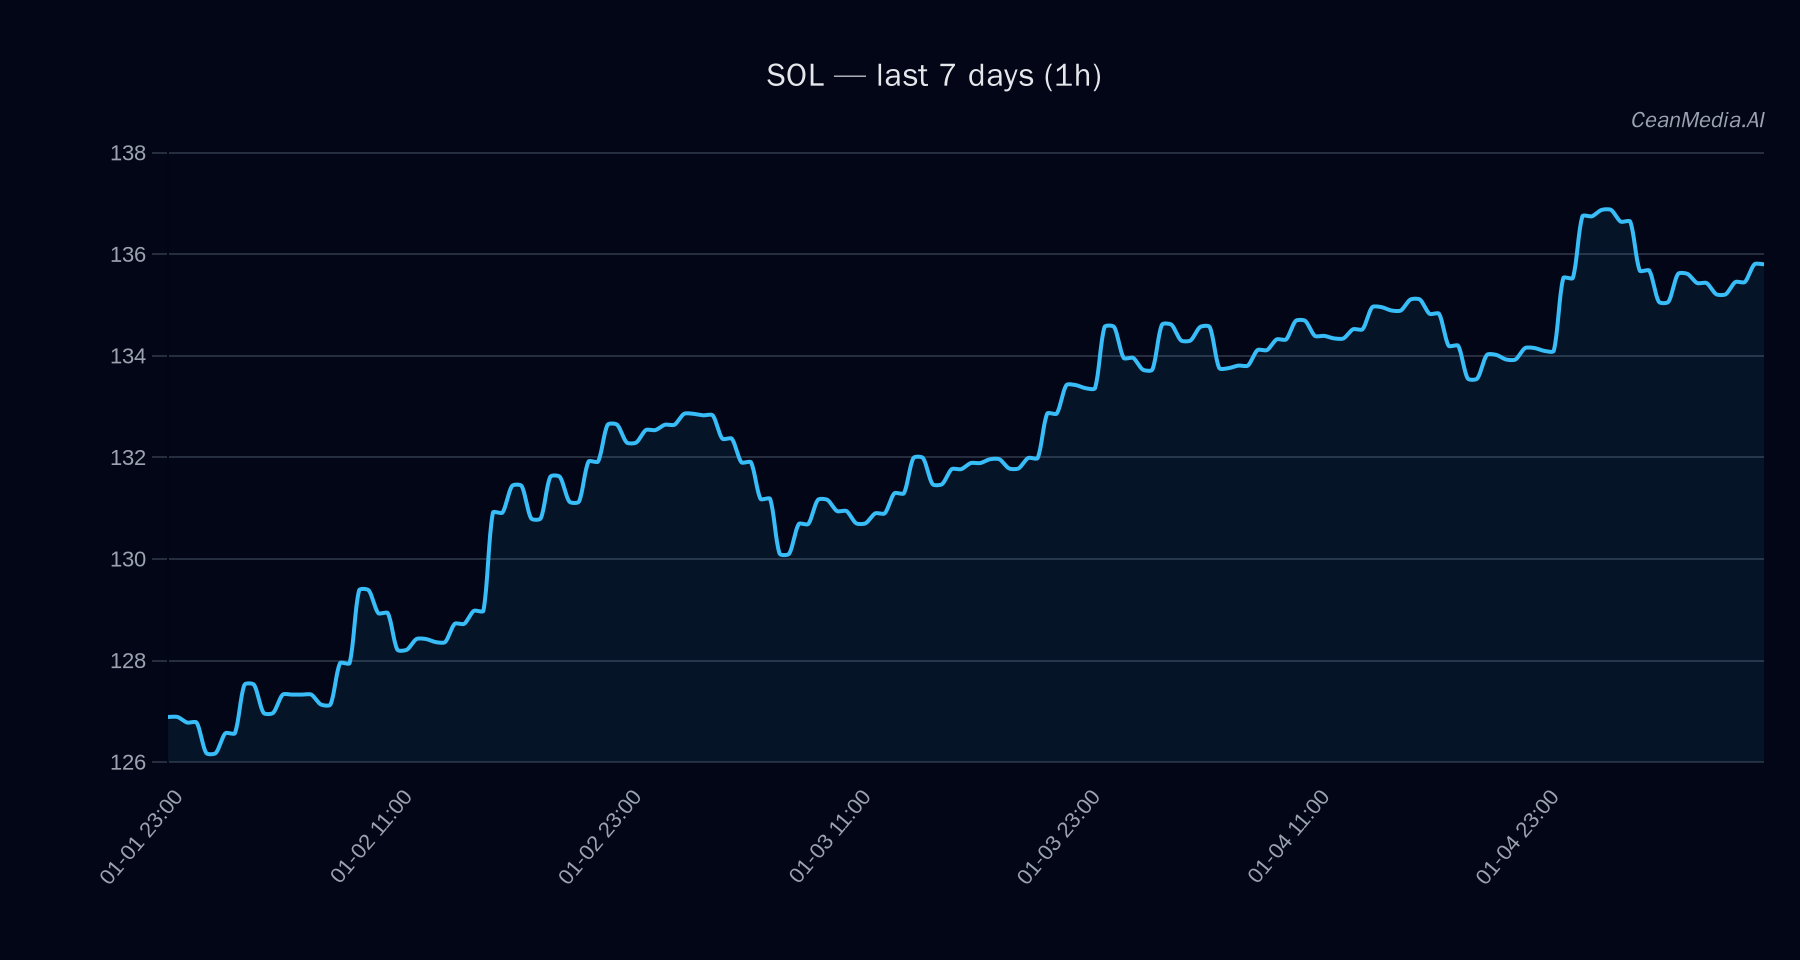
Technical Analysis: SOL
Solana’s current price sits between key support at approximately $133 and resistance at around $138. A break above $138 would target levels near $141 to $144, signaling potential short-term upside. Conversely, a breach below support at $133 could lead to declines towards $127 to $130. The technical indicators are bullish: EMA12 is above EMA26, SMA50 exceeds SMA200, and the RSI remains neutral at 56. The volatility over the past 24 hours is very low (σ 0.40%), suggesting subdued price movements. The market bias is bullish with a slight tilt towards upward momentum, but with a probability of only 48% for immediate upside, indicating cautious positioning. Invalidations would occur if SOL closes below $133, invalidating the bullish setup.
Drivers
- Return 24H: +0.01%
- EMA Slope: Slight upward trend (0.0003)
- Funding Z-Score: -1.84, indicating slight bearish funding pressure
- Basis Z-Score: -0.81
- Order Book Imbalance (EMA5): +0.0017, supporting short-term bullish momentum
- Bitcoin 24H Return: +2%
- Bitcoin Vol Regime: Very low (1), indicating subdued market volatility
- Bitcoin Trend Strength: 1.55, showing moderate trend strength
Overall, the top drivers reflect a cautious but positive momentum, with Bitcoin’s stability providing a supportive backdrop for SOL’s near-term outlook.
ETF Flows (BTC/ETH)
Recent ETF flow data indicates a risk-on environment for Bitcoin, with a 1-day inflow of approximately $471.3 million, although over the past 5 days, flows have been negative (-$39.2 million) and over 10 days, a significant outflow of about $903.7 million. Ethereum ETFs have experienced a consistent inflow over the last 1 and 5 days, totaling around $174.5 million and $118.4 million respectively, with minimal outflows over 10 days. While these flows primarily pertain to Bitcoin and Ethereum, they provide context for broader market sentiment—indicating a short-term risk-on stance that could support altcoins like SOL, but should not be solely relied upon for SOL-specific trading decisions.
What to Watch Next
- Monitor the price action around $138 resistance for potential breakout confirmation
- Watch for a decisive move below $133 support, which could signal downside risk
- Keep an eye on Bitcoin ETF flows as an indicator of overall market risk appetite
- Observe changes in market volatility and breadth for signs of trend acceleration or reversal
Note: ETF flows are only for BTC and ETH and serve as macro context; they are not primary signals for SOL’s immediate price movement.
Hashtags: #Solana #CryptoAnalysis #MarketUpdate #BTC #ETH #Altcoins #CryptoTrends #TechnicalAnalysis #ETFFlows #CryptoNews #Blockchain