Market Snapshot
On January 7, 2026, Binance Coin (BNB) trades around the $901 level with a neutral short-term bias. Market sentiment remains cautious, with low volatility and sideways movement expected in the near term. ETF flows in Bitcoin and Ethereum indicate differing investor risk appetites, providing broader market context.
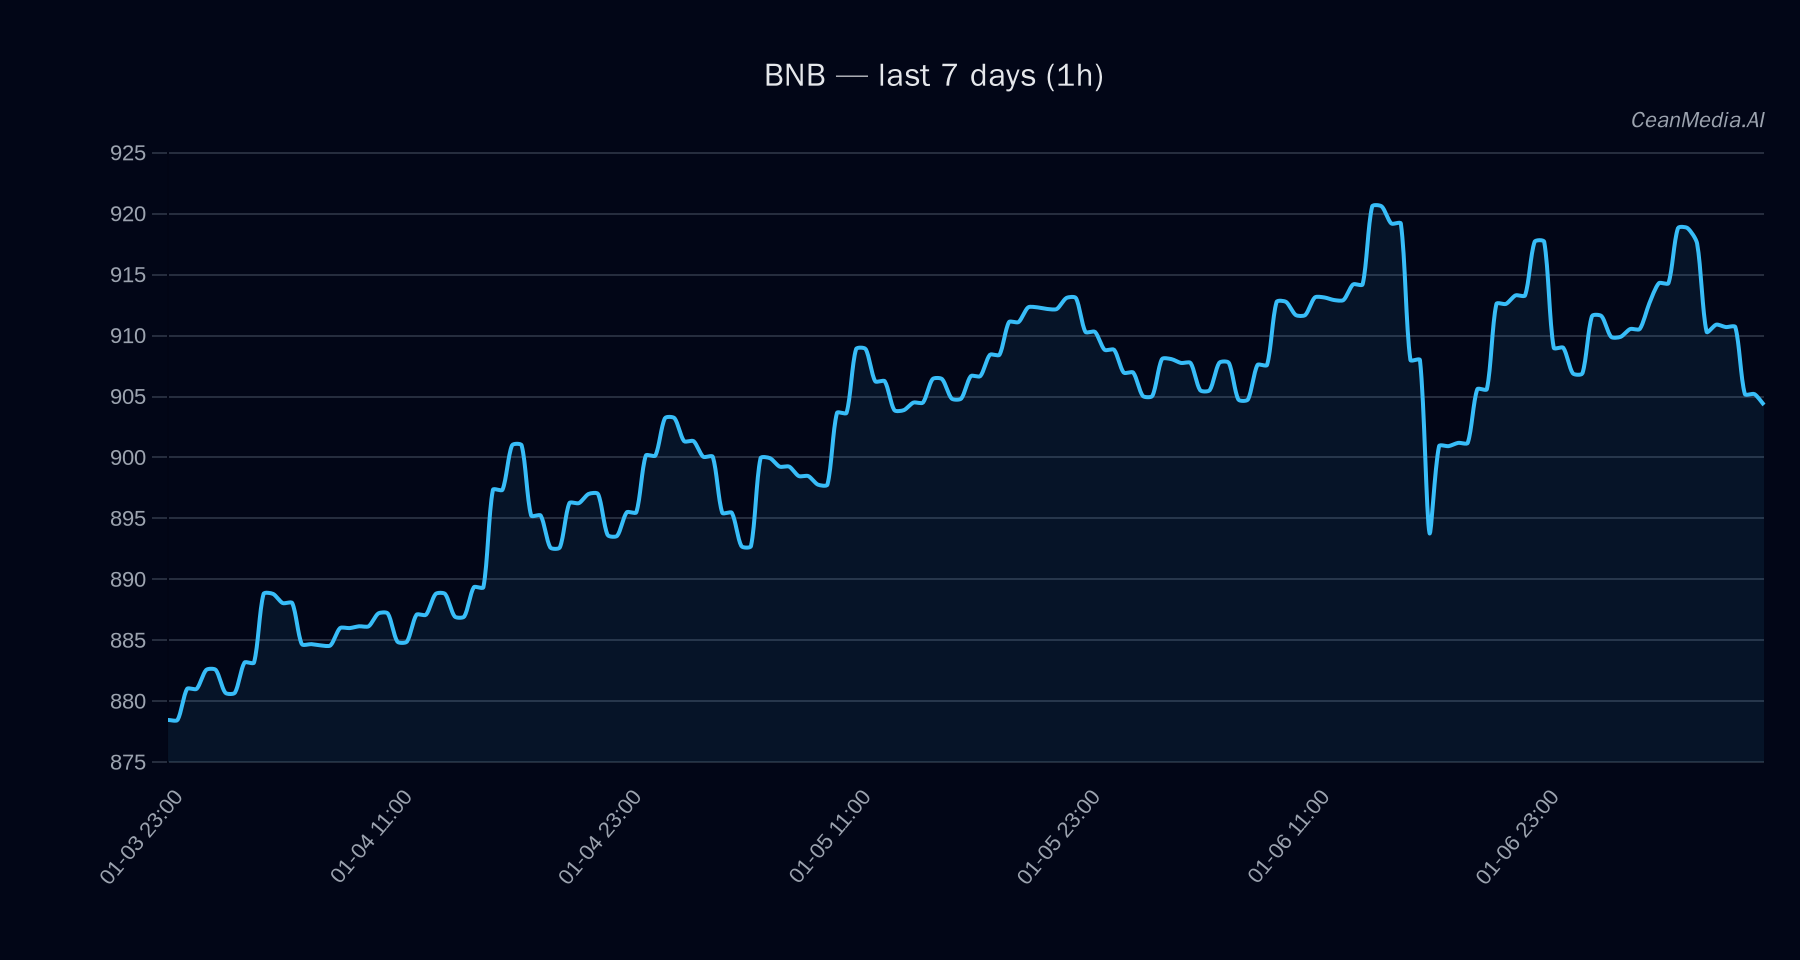
Technical Analysis: BNB
BNB is currently trading between key support at approximately $883 and resistance near $919. The technical indicators suggest a sideways trend with a slight tilt towards downside. Key levels to watch include:
- Support: Major at $853, near-term at $883
- Resistance: Major at $906, near-term at $919
If price closes above $919, a move towards $938–956 could be triggered. Conversely, a break below $883 may lead to declines towards $866–848. The current bias is sideways, with EMA12 below EMA26, SMA50 above SMA200, and RSI at 40, indicating neutral momentum. The low volatility regime supports a cautious outlook.
Drivers
- Return 24H: Slight negative at -0.01%
- EMA Slope: Negative at -0.001, indicating a mild downtrend
- Funding Z-Score: 0.37, suggesting neutral funding conditions
- Basis Z-Score: -2.31, indicating slight negative basis pressure
- Order Book Imbalance (EMA5): -0.07, favoring sellers
- BTC Return 24H: -0.02%, reflecting minor market weakness
- BTC Volatility Regime: Low (1), indicating stability
- BTC Trend Strength: 1.03, showing moderate momentum
Overall, momentum indicators point to a cautious, sideways trading environment for BNB, with no strong directional bias.
ETF Flows (BTC/ETH)
Recent ETF flow data for Bitcoin and Ethereum highlight contrasting investor behaviors. Bitcoin ETFs experienced a net outflow of approximately $243 million over one day but saw a net inflow of $710 million over five days, suggesting short-term risk-off sentiment but longer-term accumulation. Ethereum ETFs, on the other hand, registered consistent inflows, totaling $113 million daily and larger inflows over five and ten days, indicating a relatively risk-on stance for ETH.
It is important to note that these ETF flows are specific to BTC and ETH and serve as broader market context rather than direct signals for BNB. Nonetheless, the inflows into ETH suggest a cautious but positive environment for altcoins, while Bitcoin activity reflects mixed risk appetite.
What to Watch Next
- Monitor if BNB breaks above resistance at $919 for potential upward acceleration.
- Watch for a decisive move below support at $883, which could signal further downside.
- Observe broader crypto market flows, especially ETH ETF inflows, for signs of risk sentiment shifts.
- Keep an eye on Bitcoin ETF outflows and volatility regimes for market risk cues.
Hashtags: #BNB #CryptoAnalysis #TechnicalAnalysis #ETFFlows #Bitcoin #Ethereum #Altcoins #MarketTrends #CryptoNews #RiskOn #RiskOff