Market Snapshot
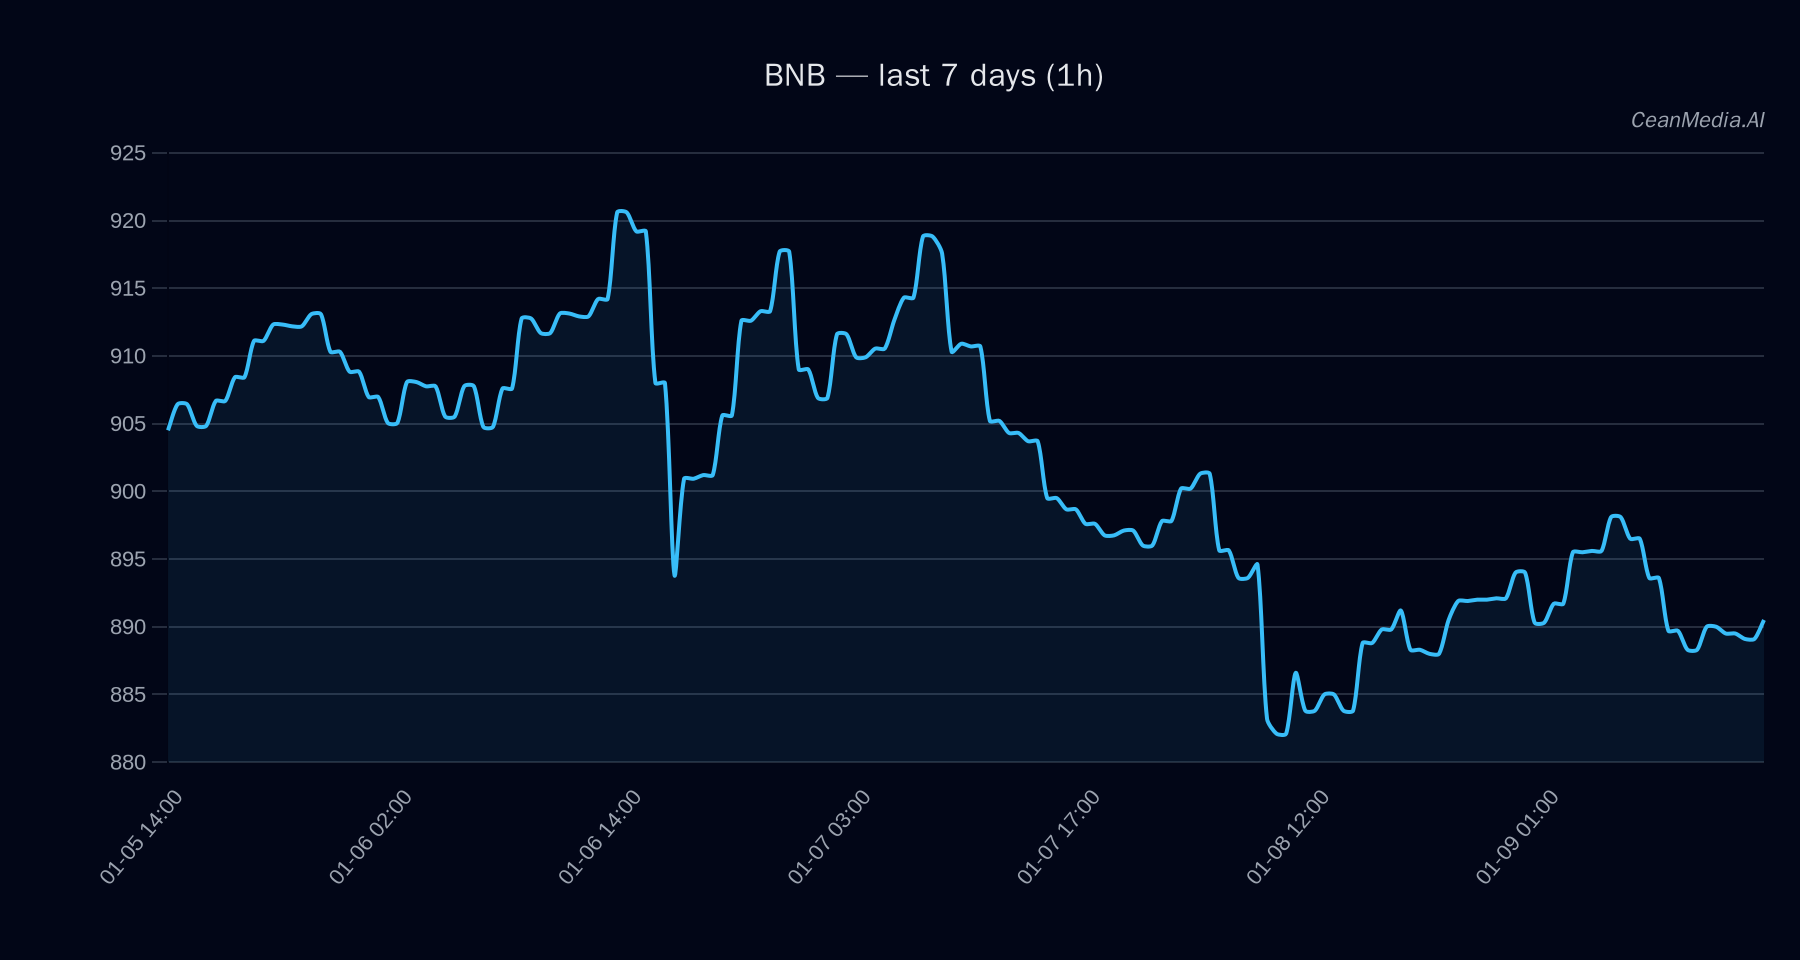
As of January 9, 2026, BNB trades around $888, with a short-term bias leaning towards upward movement, supported by a modest 49% probability. The broader market environment shows very low volatility and sideways momentum, with key technical indicators signaling a neutral stance.
Technical Analysis: BNB
- Current Price: $888.16
- Support Levels: Major support at $846; Near support at $870
- Resistance Levels: Major and near resistance at $906
- Forecast: Slightly skewed towards upside if price closes above $906, targeting $924.04–$942.16. Conversely, a close below $870 could see a decline to $835.58–$852.99.
- Technical Bias: Sideways, with EMA12 below EMA26, SMA50 above SMA200, RSI at 42 indicating neutrality, and very low volatility regime.
- Invalidation: Break below $870 invalidates near-term bullish scenarios; break above $906 confirms potential upside breakout.
Drivers
- Top factors include a modest 0.62% return over the last 24 hours and a slight negative EMA slope (-0.0001).
- Funding Z-Score (-0.73) and Basis Z-Score (-0.89) suggest limited directional strength.
- Order-book imbalance remains minimal (-0.02), indicating balanced order flow.
- BTC’s 24-hour return at 0.71% supports a cautious market tone, while BTC trend strength remains moderate at 0.45.
- Overall, momentum and volatility are subdued, reflecting a cautious market environment.
ETF Flows (BTC/ETH)
Recent ETF data shows a notable outflow from BTC ETFs over the past day, with a decline of $205.5 million, but a net inflow over 5 and 10 days. ETH ETFs experienced a smaller daily outflow but positive flows over longer periods. This suggests a cautious risk-on/off environment, with short-term outflows possibly indicating profit-taking or risk aversion, while longer-term inflows imply sustained interest in these assets. It is important to note that this ETF data pertains only to BTC and ETH and should be considered as contextual rather than primary signals for BNB.
What to Watch Next
- Monitor BNB’s price action around the $870 support and $906 resistance levels for potential breakout signals.
- Observe shifts in ETF flows for BTC and ETH as indicators of broader risk sentiment.
- Keep an eye on technical momentum indicators, particularly RSI and moving averages, for signs of trend change.
- Watch for any significant market news or macroeconomic developments that could influence crypto markets broadly.
Hashtags: #BNB #CryptoAnalysis #MarketUpdate #TechnicalAnalysis #ETFFlows #CryptoTrends #Bitcoin #Ethereum #Altcoins #MarketSentiment #TradingSignals #CryptoNews