Market Snapshot
As of January 9, 2026, Solana (SOL) is trading around $138.75, with a short-term bias leaning towards downside. Recent ETF flows for Bitcoin and Ethereum suggest a mixed risk sentiment, with Bitcoin experiencing notable outflows over the past week while ETH shows some inflows. These macro movements provide context but are not primary signals for SOL.
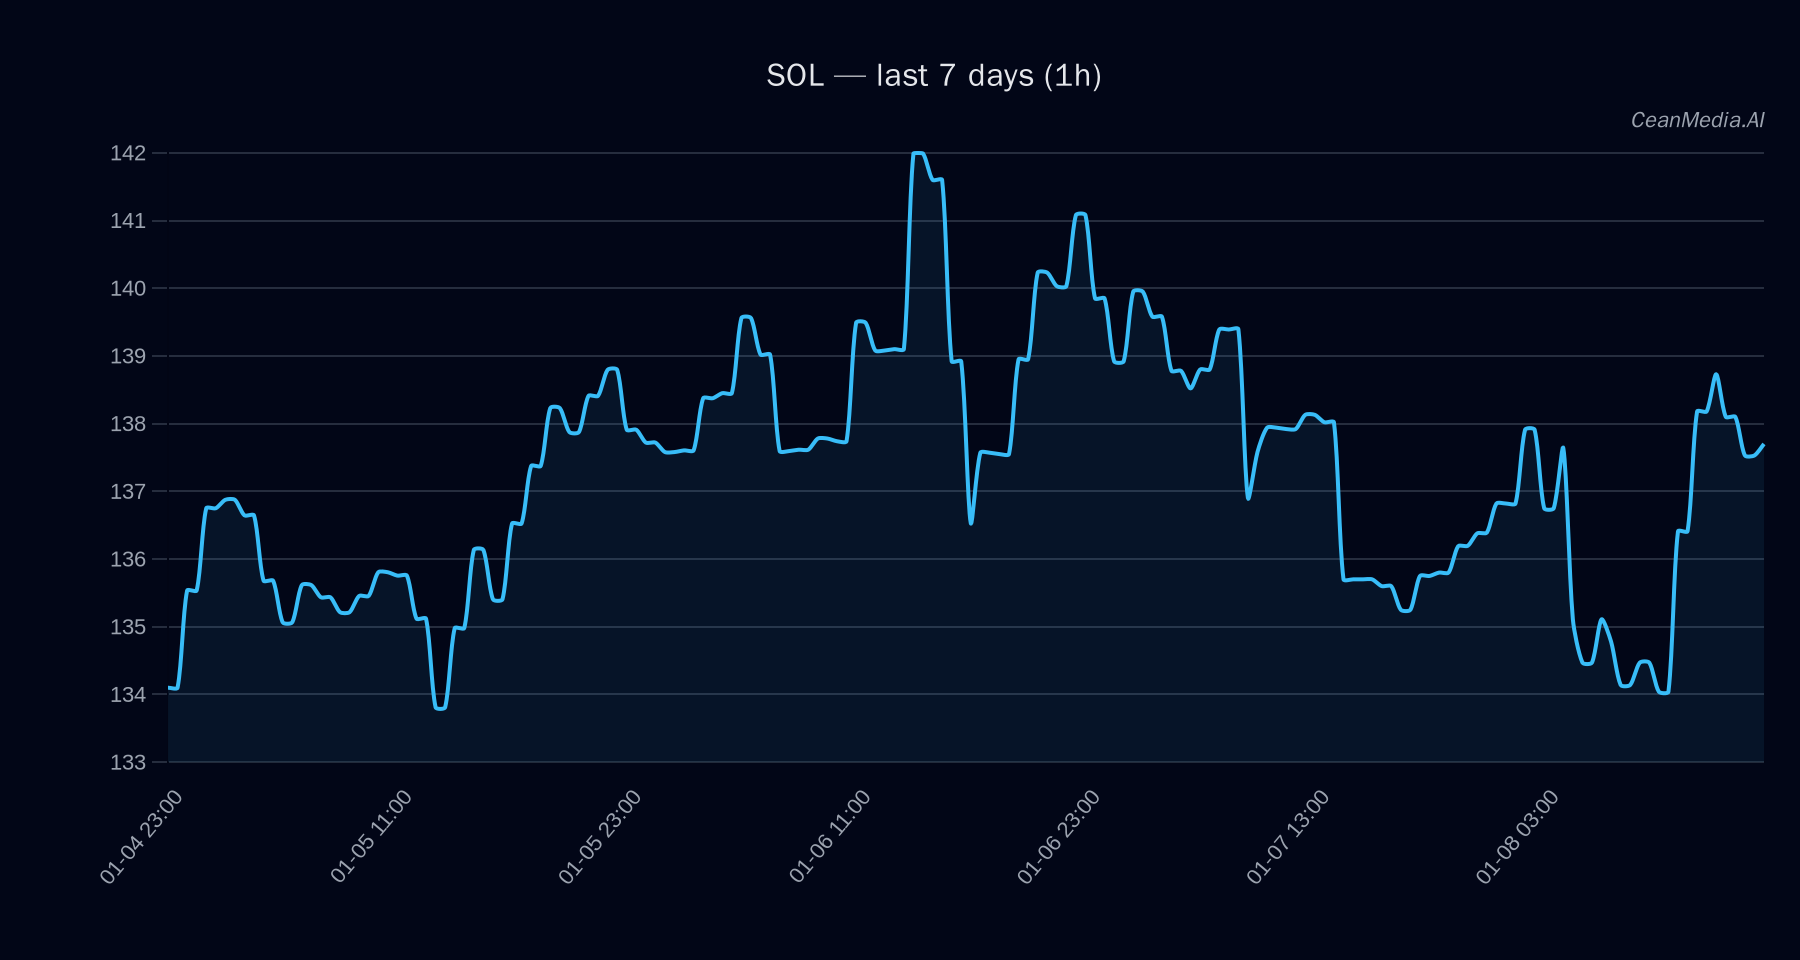
Technical Analysis: SOL
- Levels: SOL is currently situated between key support at approximately $136 and resistance at around $142. A break above $142 could target $144.36–$147.19, while a break below $136 could lead to levels around $130.54–$133.26.
- Bias: Despite bullish technical indicators such as EMA12 > EMA26, SMA50 > SMA200, and RSI at 59, the forecast indicates a 51% probability of downward movement in the short term.
- Triggers & Invalidation: A decisive close above $142 would confirm bullish momentum targeting higher levels, whereas a close below $136 would invalidate bullish assumptions and suggest further downside.
- Indicators: RSI is neutral; volatility remains very low with minimal trading regime activity, supporting a cautious outlook.
Drivers
- Top drivers include a modest 24-hour return of approximately 0.01%, positive EMA slope (0.0011), and a neutral funding Z-score (-0.56).
- Market momentum remains subdued with low volatility and limited order book imbalance (-0.02 EMA5 imbalance).
- Bitcoin’s recent marginal decline (-0.0014 return) and its stable trend strength (0.09) suggest limited influence on SOL’s immediate direction.
ETF Flows (BTC/ETH)
Recent ETF flows reveal a risk-off sentiment: Bitcoin ETFs experienced a significant outflow of approximately $486.1 million over the past day, while Ethereum ETFs saw inflows totaling around $98.3 million. Over five days, BTC saw a modest inflow of $91.1 million, but over ten days, it faced a net outflow of $435.2 million. ETH, on the other hand, maintained positive flows over the longer term. These movements indicate cautious investor sentiment toward Bitcoin, with Ethereum attracting some risk appetite. While this context helps gauge market tone, it should not be solely relied upon for SOL trading decisions.
What to Watch Next
- Monitor SOL’s price action around key support ($136) and resistance ($142) levels for potential breakout or breakdown signals.
- Observe broader crypto market sentiment and macroeconomic factors, especially Bitcoin ETF flows, which may influence risk appetite.
- Keep an eye on volatility regimes and volume activity to assess potential shifts in momentum.
- Watch for any significant news or developments related to Solana ecosystem that could impact short-term price movements.
Hashtags: #Solana #Cryptocurrency #TechnicalAnalysis #CryptoMarkets #BTC #ETH #ETFFlows #MarketUpdate #CryptoNews #TradingTips #Blockchain