Market Snapshot
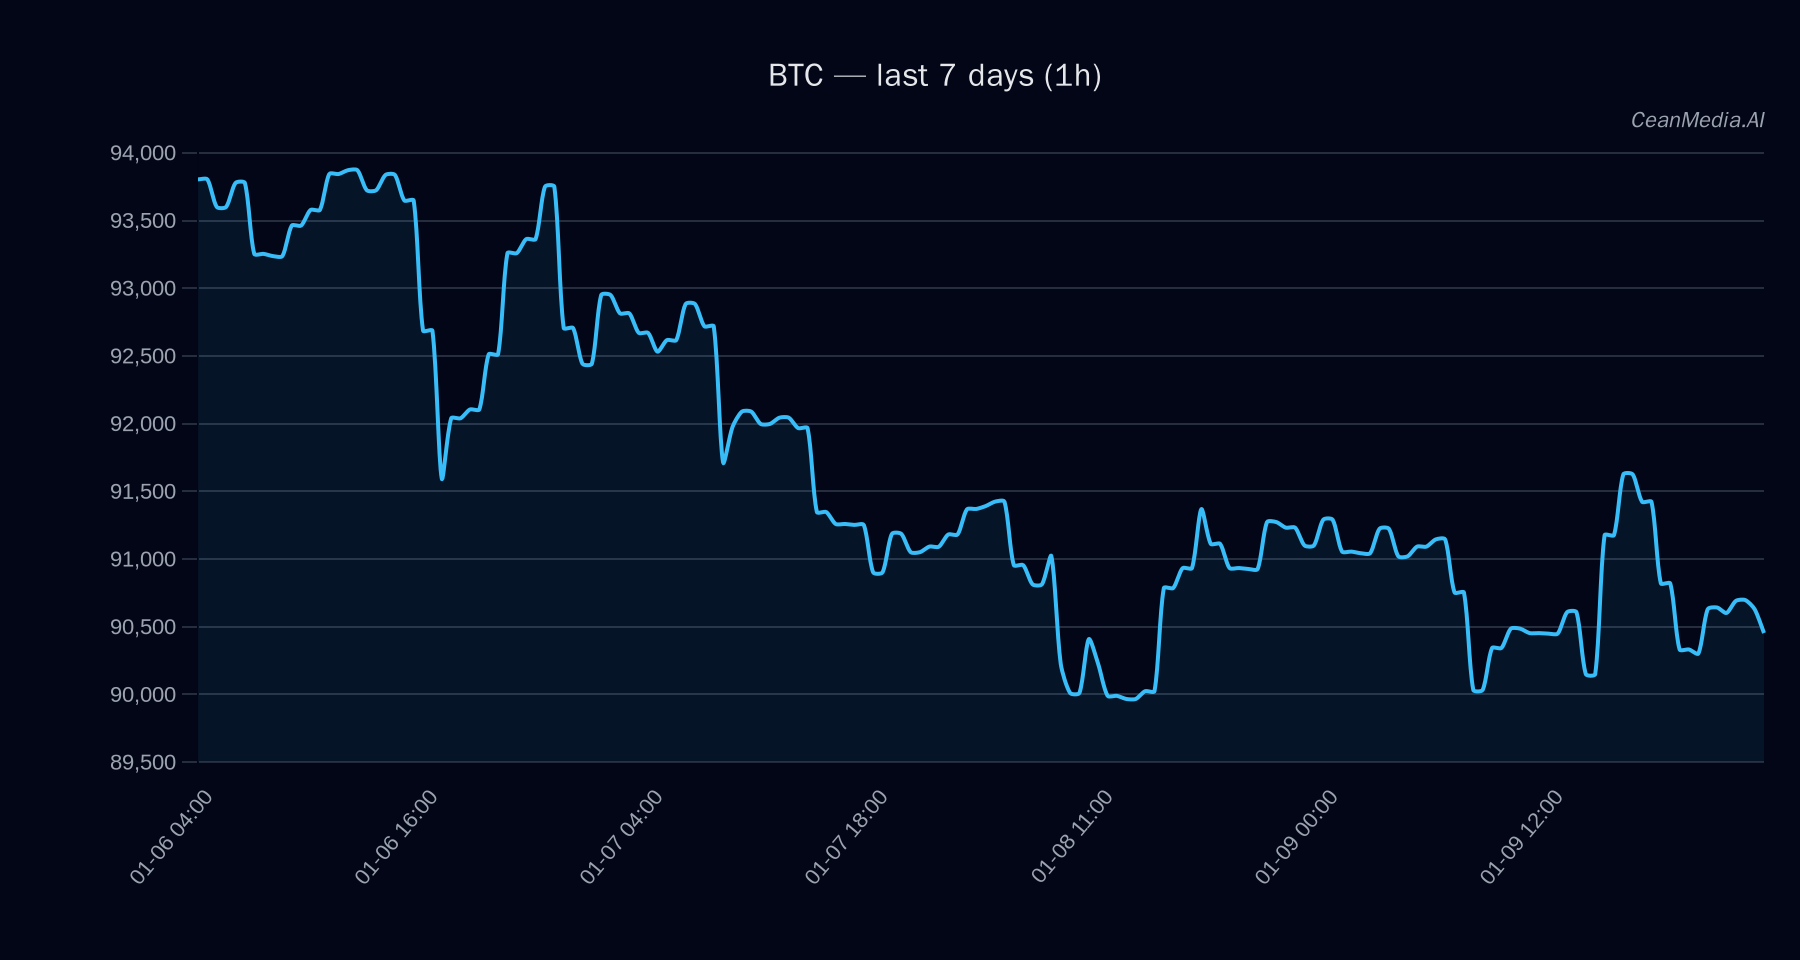
Bitcoin is currently trading around $90,540, with a neutral to slightly bearish bias based on recent technical indicators. The market exhibits very low volatility, and the overall sentiment is cautious, with a 24-hour return close to zero. ETF flows for BTC and ETH suggest mixed risk appetite, providing additional context for the current landscape.
Technical Analysis: BTC
- Levels: Support at approximately $88,725; resistance at about $92,350. A break above resistance targets levels near $94,198 to $96,045, while a breakdown below support points to levels around $86,955 to $85,180.
- Bias: Bearish in the short term, supported by EMA and SMA alignment (EMA12
- Triggers: A close above $92,350 could accelerate upward movement towards $94,198–$96,045. Conversely, a close below $88,725 may lead to further declines toward $86,955–$85,180.
- Invalidation: Bullish scenario invalidated if the price closes below support at $88,725 for sustained periods.
Drivers
- Top factors: 24-hour return near zero (-0.0065), slight negative EMA slope, and ETF outflows over the past 5 days (-$428.9M) indicate a cautious market sentiment.
- Momentum and volatility: Volatility regime remains very low, with a volatility of 0.40%. The basis Z-score is elevated at 1.05, suggesting some underlying short-term bullish bias, but overall momentum remains subdued.
- Market breadth: Breadth indicator is above 50 hours at 17%, and correlation with 72-hour timeframe is perfect (1.00), indicating short-term market stability but limited participation.
ETF Flows (BTC/ETH)
Current ETF flows show BTC ETFs with a slight positive daily inflow (+$2.0M), but a significant net outflow over the past 5 days (-$428.9M). ETH ETFs, in contrast, experienced a minor daily outflow (-$10.0M) but positive flows over 5 and 10 days (+$13.6M and +$132.0M respectively). These flows suggest a cautious risk-on/off sentiment, with recent BTC outflows indicating some profit-taking or risk aversion, while ETH shows signs of sustained inflow, possibly reflecting a rotation into altcoins.
What to Watch Next
- Monitor the key support at $88,725 and resistance at $92,350 for breakout signals.
- Observe ETF flow trends, especially if BTC inflows resume or continue to decline.
- Watch for a potential change in momentum if Bitcoin closes convincingly above or below critical levels.
- Keep an eye on broader market sentiment indicators and macroeconomic developments that could influence risk appetite.
Note: ETF flow data is limited to BTC and ETH and serves as contextual information rather than primary trading signals.
Hashtags: #Bitcoin #CryptoAnalysis #MarketUpdate #CryptoSignals #ETFFlows #BTC #ETH #TradingStrategy #MarketTrends #CryptoNews #TechnicalAnalysis #FinancialMarkets