Market Snapshot
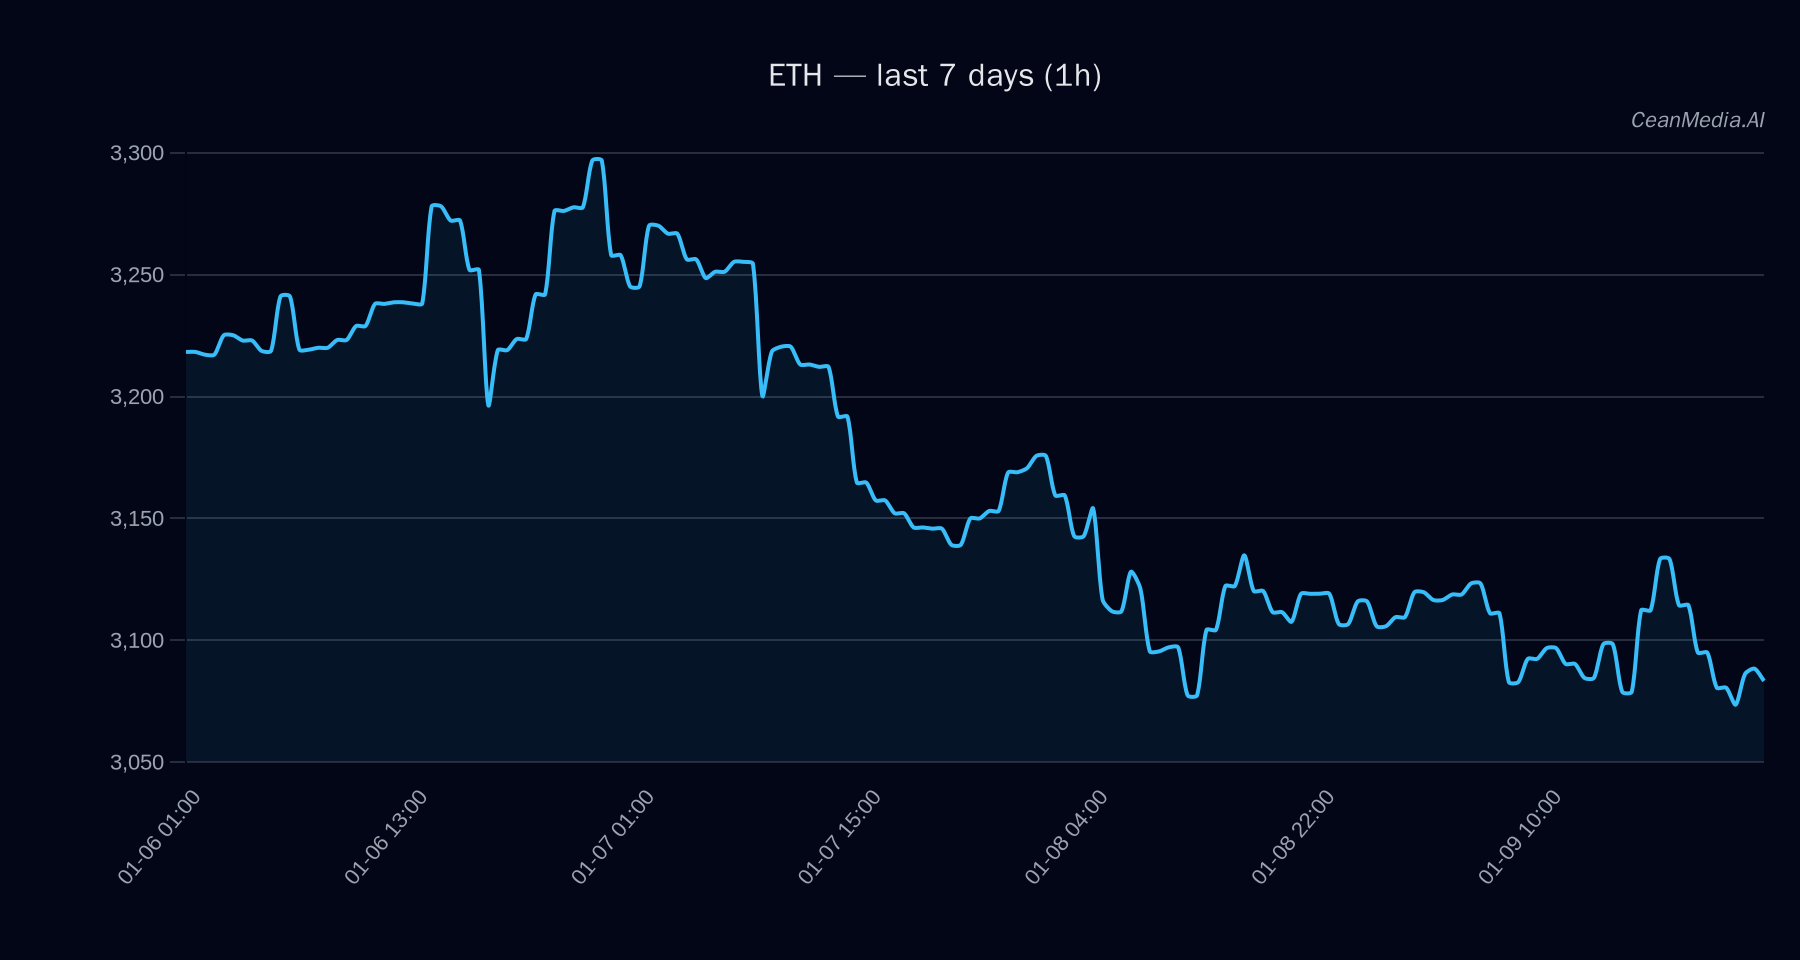
As of January 10, 2026, Ethereum (ETH) is trading around $3,090.83. The overall market sentiment remains cautious with a slight bearish bias. ETH’s short-term technical indicators suggest a potential downside continuation, supported by low volatility and neutral RSI levels. Broader market conditions show low participation and extreme fear sentiment, which could influence near-term price actions.
Technical Analysis: ETH
- Key Levels: Support at approximately $3,030 (major support), resistance near $3,152 (major resistance). Break above resistance could target $3,216–$3,279. Conversely, a break below support may see prices decline to $2,968–$2,908.
- Bias and Signals: Bearish bias indicated by EMA12 below EMA26, and SMA50 below SMA200. RSI at 46 suggests neutral momentum. Volatility remains very low, indicating subdued trading activity.
- Triggers: A close above $3,152 may signal a bullish move towards $3,279, while a close below $3,030 could accelerate downside to near $2,908. Invalidations are set by these levels, respectively.
Drivers
- Top Factors: The 24-hour return of ETH is marginally negative at -0.01, and the EMA slope remains slightly negative (-0.0005), reinforcing the bearish short-term outlook.
- Market Sentiment & Momentum: Funding and basis Z-scores are neutral (~0.92-0.93), with ETF flows showing a recent 60-day outflow of -$1.34M, indicating cautious investor positioning.
- Volatility & Trend: Market volatility remains very low, with trend strength moderate at approximately 0.46, and no significant divergence observed in order book imbalances.
ETF Flows (BTC/ETH)
It is important to note that ETF flow data is only available for Bitcoin and Ethereum and mainly reflects broader risk-on/off sentiment rather than direct signals for ETH’s price. Recent data shows:
- Bitcoin ETF flows have been predominantly negative over the past day (-$399M), though 5-day flows are positive (+$40M), indicating mixed investor sentiment.
- Ethereum ETF flows are also negative for the past day (-$159M), but over 5 and 10 days, flows are positive (+$198M and +$89M respectively), suggesting a cautious but gradually improving risk appetite.
What to Watch Next
- Monitor ETH’s ability to break above the resistance at $3,152 for confirmation of potential bullish reversal.
- Watch for a sustained move below $3,030 which could lead to further downside targeting $2,908.
- Keep an eye on broader market sentiment and ETF flows for signs of risk appetite or aversion, especially in relation to Bitcoin.
- Observe volatility regimes and order book dynamics for early indications of trend shifts.
Hashtags: #Ethereum #CryptoAnalysis #MarketUpdate #ETFHedges #CryptoFlows #BTC #Altcoins #TechnicalAnalysis #MarketSentiment #CryptoNews #RiskOn #RiskOff