Market Snapshot
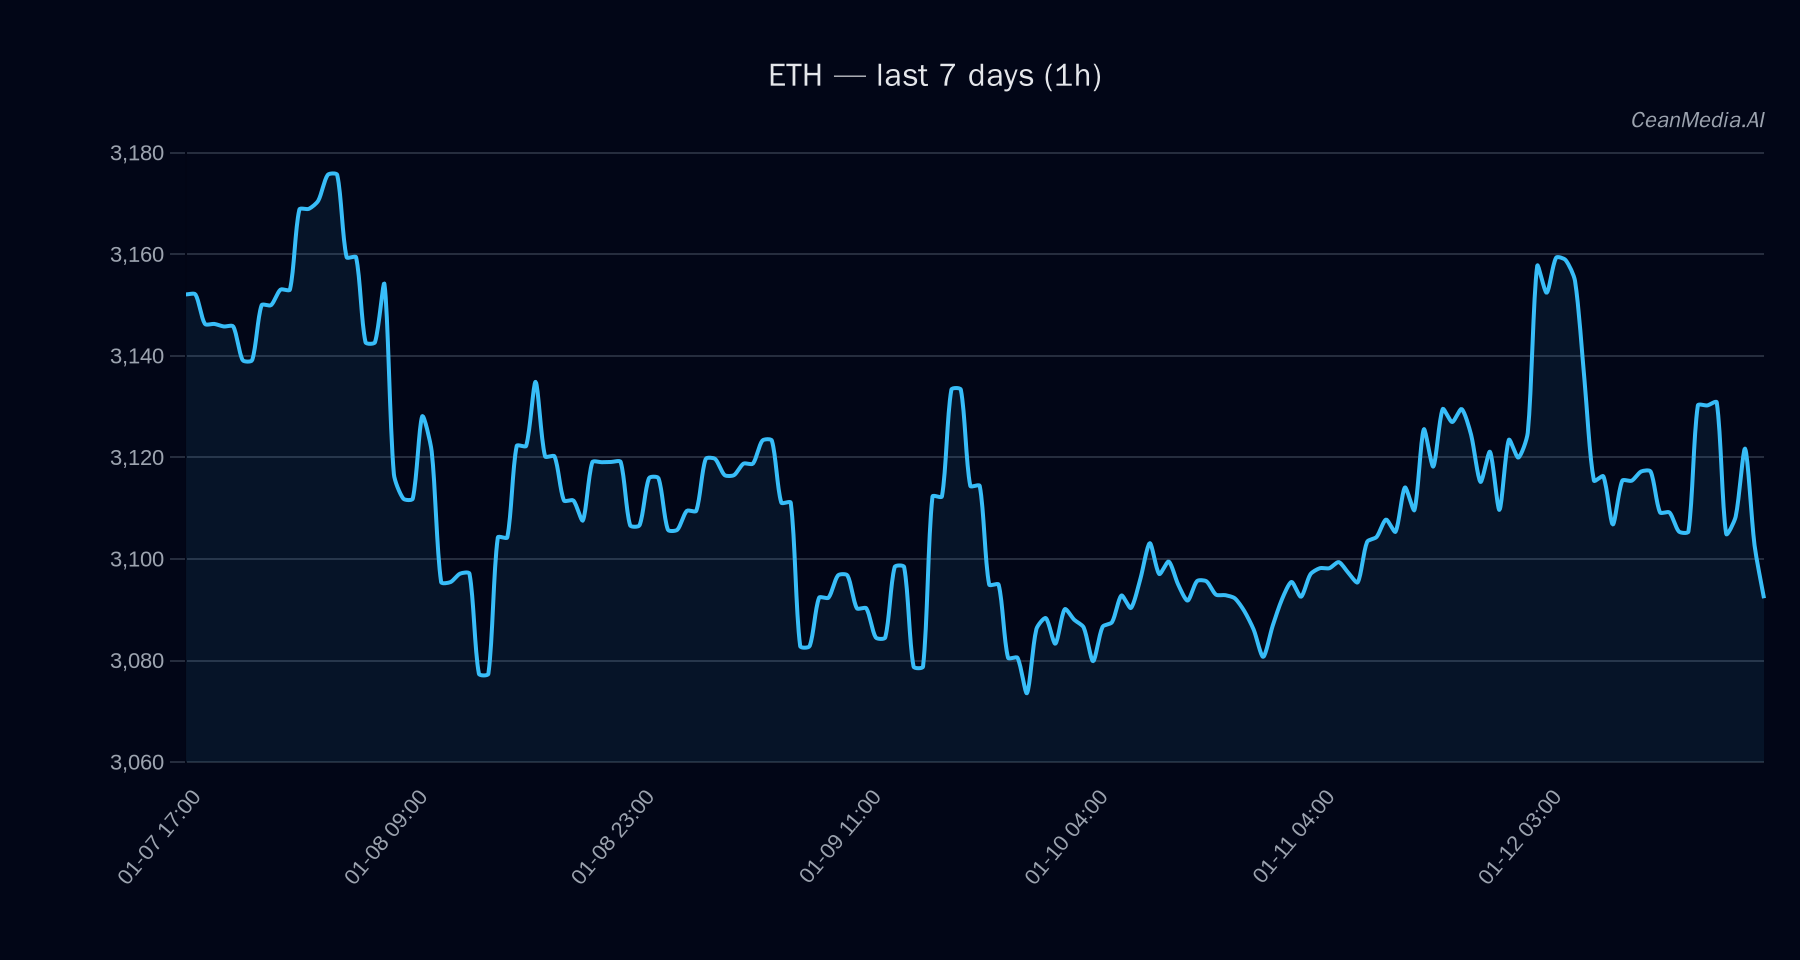
As of January 13, 2026, Ethereum (ETH) is trading near key support and resistance levels, with a current price of approximately $3,092. The broader market displays a cautious tone, with low volatility and neutral momentum indicators. ETF flows reveal mixed investor sentiment between Bitcoin and Ethereum, suggesting nuanced risk-off or risk-on signals.
Technical Analysis: ETH
- Levels: Support is observed at around $3,030, with major resistance near $3,154. A breakout above resistance targets $3,216 to $3,280, while a decline below support risks a move toward $2,969 to $2,909.
- Bias: Bearish, with technical signals indicating downside potential. The EMA12 is below EMA26, and the SMA50 is under SMA200, confirming downward pressure.
- Triggers: A close above $3,154 could accelerate gains toward $3,280, whereas a close below $3,030 may confirm further downside.
- Invalidation: A daily close above $3,154 would challenge the bearish outlook, while a decline below $3,030 would reinforce downside momentum.
Drivers
- Top factors: The 24-hour return is nearly flat at -0.0092, with the EMA slope negatively inclined, indicating slight downward momentum. Funding and basis Z-scores are negative, reflecting bearish funding sentiment.
- Momentum/Volatility: The RSI is neutral at 41, and the 24-hour volatility sigma is very low at 0.44%, suggesting subdued market activity. The overall trend strength remains moderate.
ETF Flows (BTC/ETH)
Current ETF flows show a divergence: Bitcoin ETFs have experienced significant outflows over the past 1, 5, and 10 days, indicating risk-off sentiment towards Bitcoin. Conversely, Ethereum ETF flows are also negative over 1 and 5 days but have seen a slight inflow over 10 days, reflecting mixed investor positioning. It is important to note that ETF flows are only available for BTC and ETH and serve as contextual data rather than primary trading signals.
What to Watch Next
- Monitor if ETH breaks above $3,154 to confirm potential short-term bullish momentum.
- Watch for a decisive move below $3,030 for confirmation of continued bearishness.
- Observe evolving ETF flows for Bitcoin and Ethereum as an indicator of broader risk appetite.
- Keep an eye on macroeconomic developments that could influence market volatility and investor sentiment.
Hashtags: #Ethereum #CryptoAnalysis #MarketUpdate #CryptoTrading #BTC #ETH #CryptoInvesting #Blockchain #MarketTrends #RiskOn #RiskOff