Market Snapshot
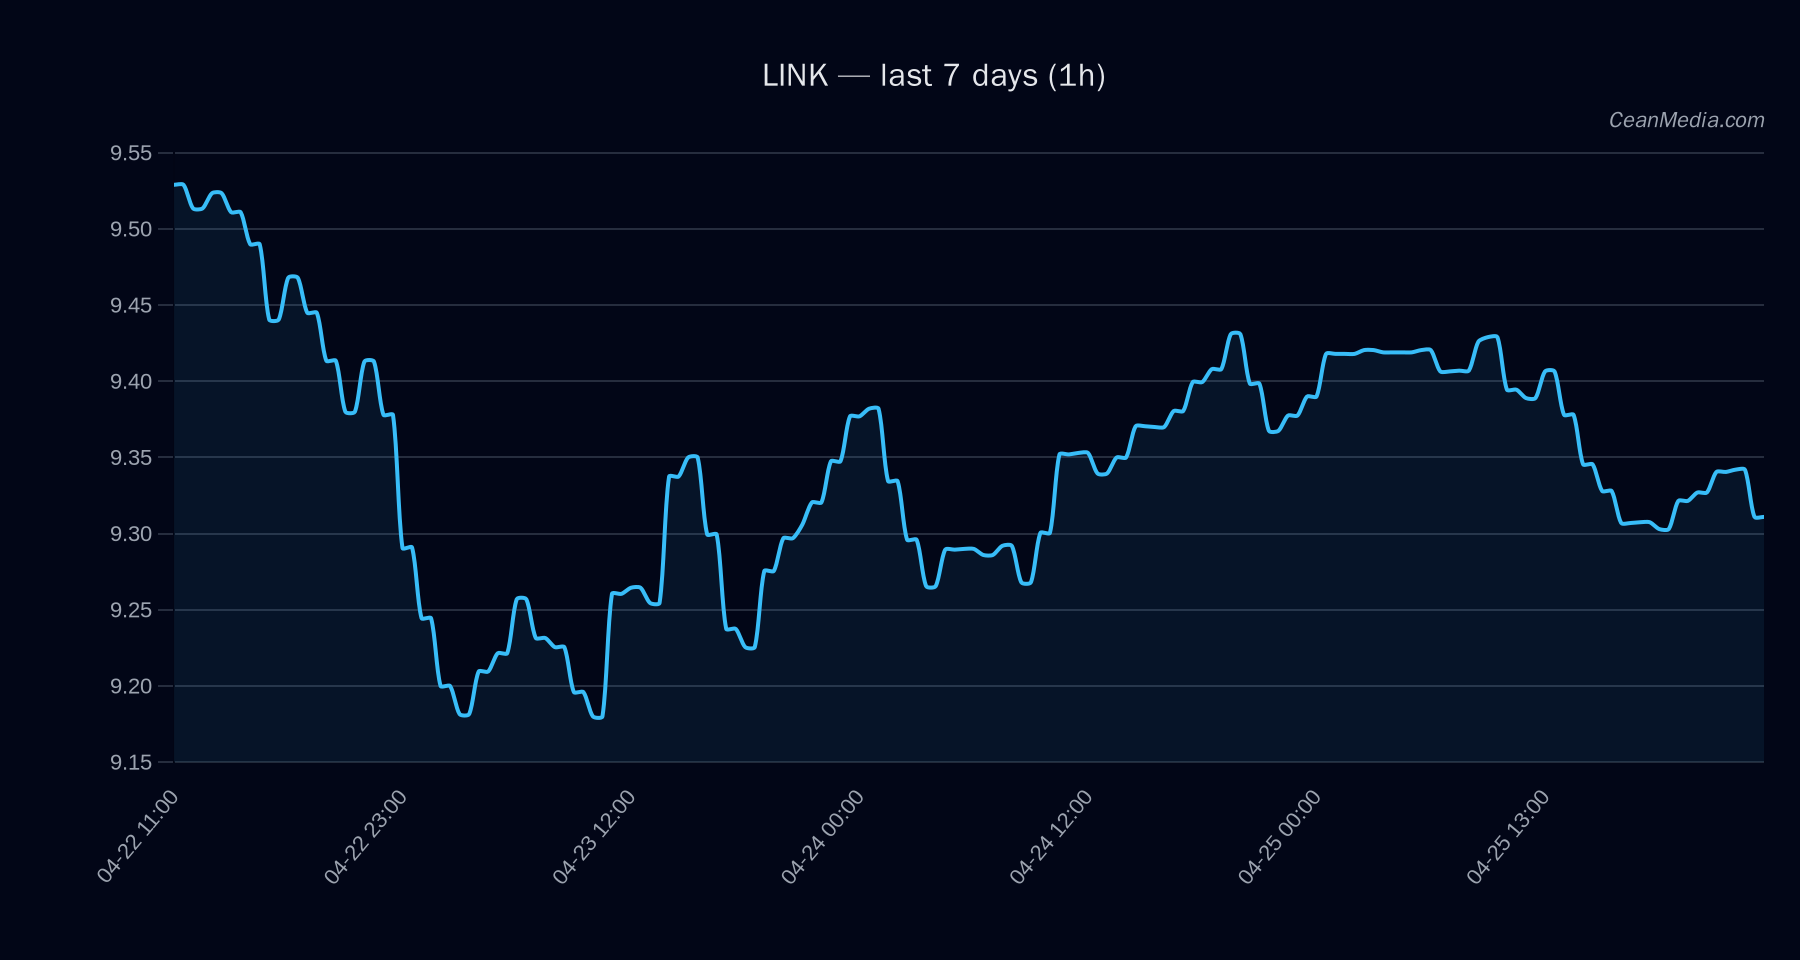
LINK is trading around the 9.3 level, with near-term support at 9.14 and resistance at 9.5. The immediate forecast favors an upside tilt (70% probability within the 24-hour horizon) but the underlying technical backdrop shows a sideways-leaning profile (EMA12
Technical Analysis: LINK
Short-term bias is Up with a forecast probability of 70% for the next 24 hours. The price range for the next move sits between the support near 9.14 and resistance near 9.5, with a potential upside to 9.6965–9.8867 should a Break > 9.5 occur. A Break < 9.14 would target 8.9509–8.7683. - Major Support: 8.8
- Near Support: 9.14
- Major Resistance: 9.5
- Near Resistance: 9.5
EMA12 < EMA26 and SMA50 > SMA200 indicate a mixed/sideways structure, RSI at 40 (neutral) and very low volume regime. This suggests limited immediate breakout potential without a catalyst. A close decisively below 9.14 would shift the view toward a pullback into the 8.77–8.95 region. Conversely, a close above 9.5 would open upside targets toward 9.70–9.89. σ24h of 0.17% signals subdued volatility, reinforcing a cautious stance on near-term directional bets.
Drivers
LS GLOBAL DELTA 24H, BTC RV 24H, LS TOP DELTA 24H, SPREAD Z-SCORE, RV 24H, BTC VOL REGIME. The current mix shows a net tilt toward price stability with limited momentum, as reflected in the modest positive trend strength (trend_strength ~0.94) but negative contributions from return and spread components. The 24H return is tiny (-0.84%), while the EMA slope is mildly negative, and the funding and basis z-scores point to mixed liquidity dynamics. Overall, the top drivers indicate a cautious, range-bound environment rather than a clear directional breakout. BTC-related indicators and regime signals suggest a conservative backdrop for LINK in the immediate term, with broad market breadth not supporting aggressive directional bets.
ETF Flows (BTC/ETH)
ETF flow context is provided for BTC and ETH, not LINK. BTC ETF shows 1D outflow of about -$8.5M, with 5D inflows of +$363.9M and 10D inflows of +$994.1M. ETH ETF shows 1D outflow of -$2.3M, with 5D inflows of +$77.8M and 10D inflows of +$300.6M. These figures are indicative of risk-on/off sentiment in the broader crypto market context and can influence asset correlations, but they are not primary signals for LINK. Traders should treat ETF data as contextual information rather than a direct driver of LINK pricing.
What to Watch Next
- Watch for a close above 9.5 to confirm a near-term upside extension toward 9.70–9.89.
- Monitor a break below 9.14 for potential decline toward 8.95–8.77.
- Assess changes in BTC/ETH ETF flows as a proxy for broader risk sentiment, while recognizing LINK-specific signals remain the primary driver.
- Keep an eye on volatility regime and volume, as a shift from very low to higher liquidity could precede a breakout or a breakdown.
Hashtags: #LINK #CryptoMarkets #TechnicalAnalysis #ETFFlows #BTC #ETH #MarketSnapshot #PriceForecast #Liquidity #RiskManagement