Market Snapshot
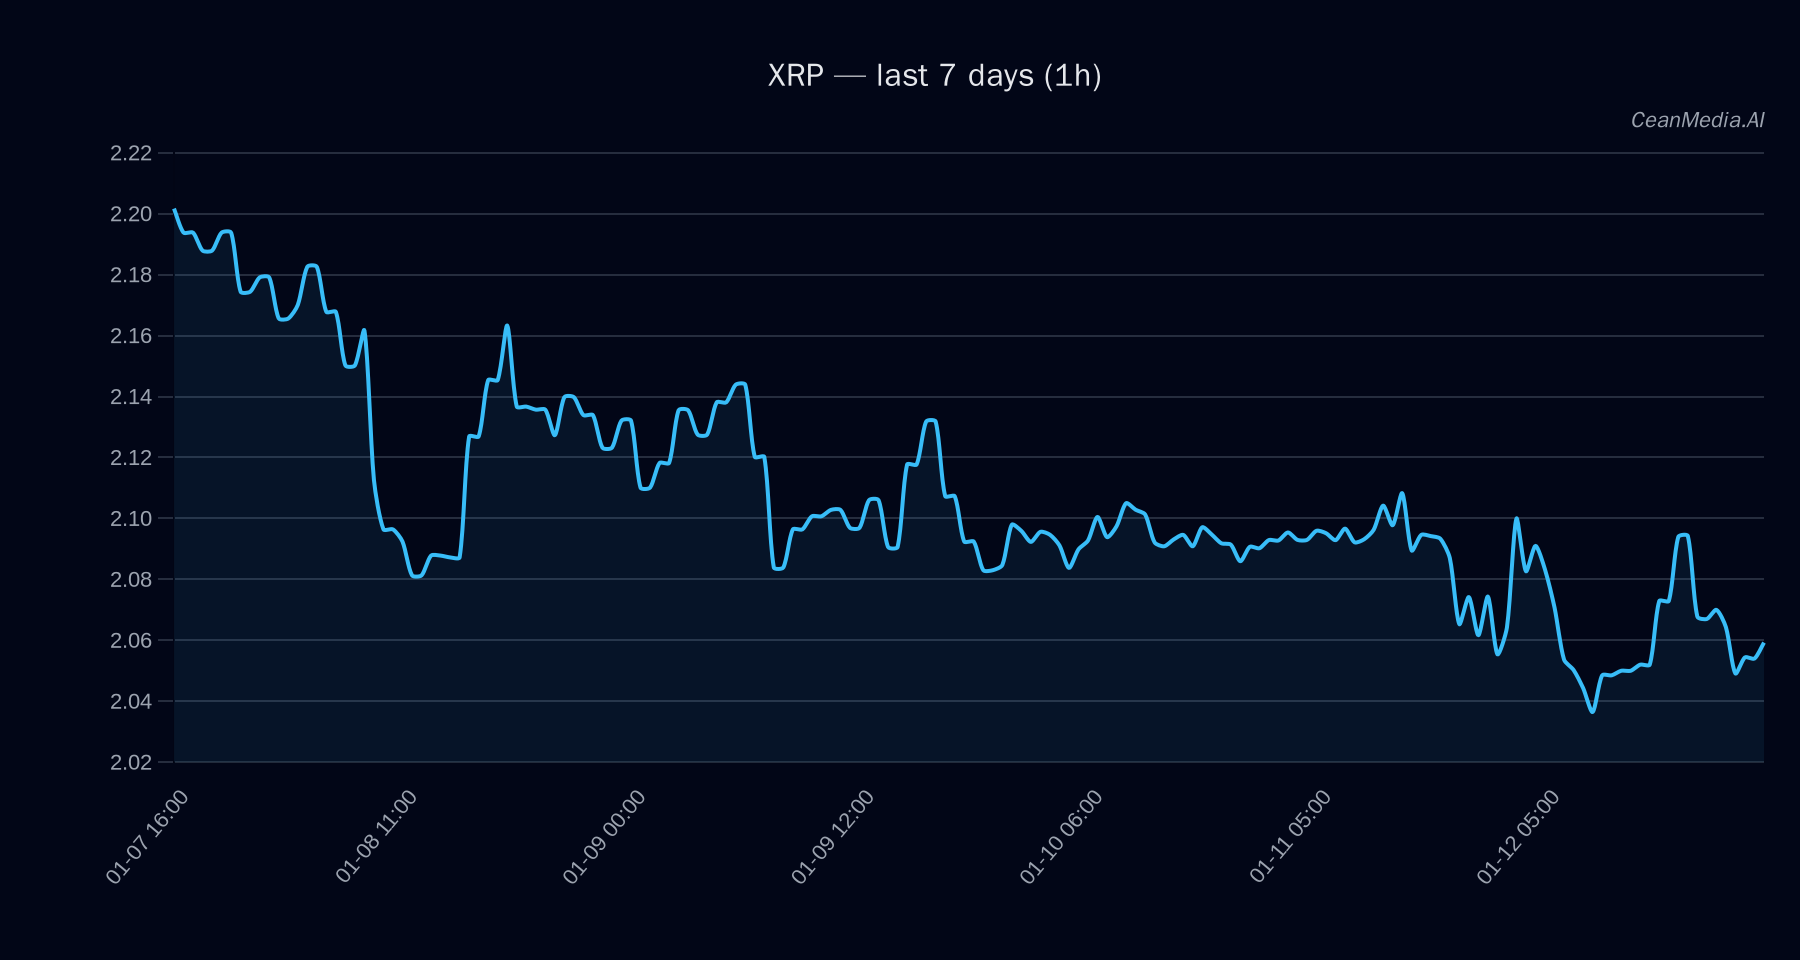
As of January 13, 2026, XRP is trading around the $2.05 level, with a short-term bearish bias indicated by technical signals. The broader market shows signs of cautious sentiment, with ETF flows for Bitcoin and Ethereum remaining predominantly negative over recent periods. This context suggests a risk-off environment, influencing altcoin moves, including XRP.
Technical Analysis: XRP
XRP currently sits between key support at approximately $2.02 and resistance near $2.10. A break above $2.10 would target a potential move towards $2.1351–$2.177, signaling bullish momentum. Conversely, a decline below support at $2.02 could lead to a move toward $1.97–$1.93, reinforcing the bearish outlook.
The technical indicators favor a bearish bias:
- EMA12 is below EMA26, indicating short-term downward momentum.
>SMA50 is below SMA200, confirming longer-term bearish trend.
RSI remains neutral at 43, not yet oversold but leaning toward downside pressure.
Volatility remains very low, suggesting subdued market activity.
Drivers
Top factors influencing XRP include:
- 24H return at -0.0098, reflecting slight recent decline.
EMA slope remains negative, supporting bearish momentum.
Funding and basis Z-scores are negative, indicating market sentiment is skewed away from bullishness.
Order-book imbalance (EMA5) is slightly positive, hinting at minor buying interest.
Bitcoin’s modest 24H return (+0.0032) and trend strength (0.15) suggest limited crypto market momentum overall.
Market volatility remains very low, and broader sentiment metrics show a cautious or slightly fearful environment.
ETF Flows (BTC/ETH)
Recent ETF data show significant outflows for Bitcoin (-$250M daily, -$680.9M over 5 days, -$720.1M over 10 days), indicating a risk-off sentiment in traditional crypto markets. Ethereum ETF flows are also negative in the short term but have shown some recovery (+$48.2M over 10 days). These flows suggest investor caution or rotation away from major crypto assets, which may indirectly impact altcoins like XRP.
It is important to note that ETF flows for BTC and ETH serve as broader market context rather than direct signals for XRP’s price action.
What to Watch Next
- Monitor XRP’s price action around the support at $2.02 and resistance at $2.10.
- Watch for a confirmed breakout or breakdown to validate the directional bias.
- Keep an eye on broader market sentiment, especially ETF flows and volatility signals.
- Observe Bitcoin and Ethereum market movements as potential risk indicators.
Hashtags: #XRP #CryptoAnalysis #MarketUpdate #Bitcoin #Ethereum #Altcoins #TradingStrategy #CryptoTrends #TechnicalAnalysis #MarketSentiment #ETFFlows #CryptoForecast