Market Snapshot
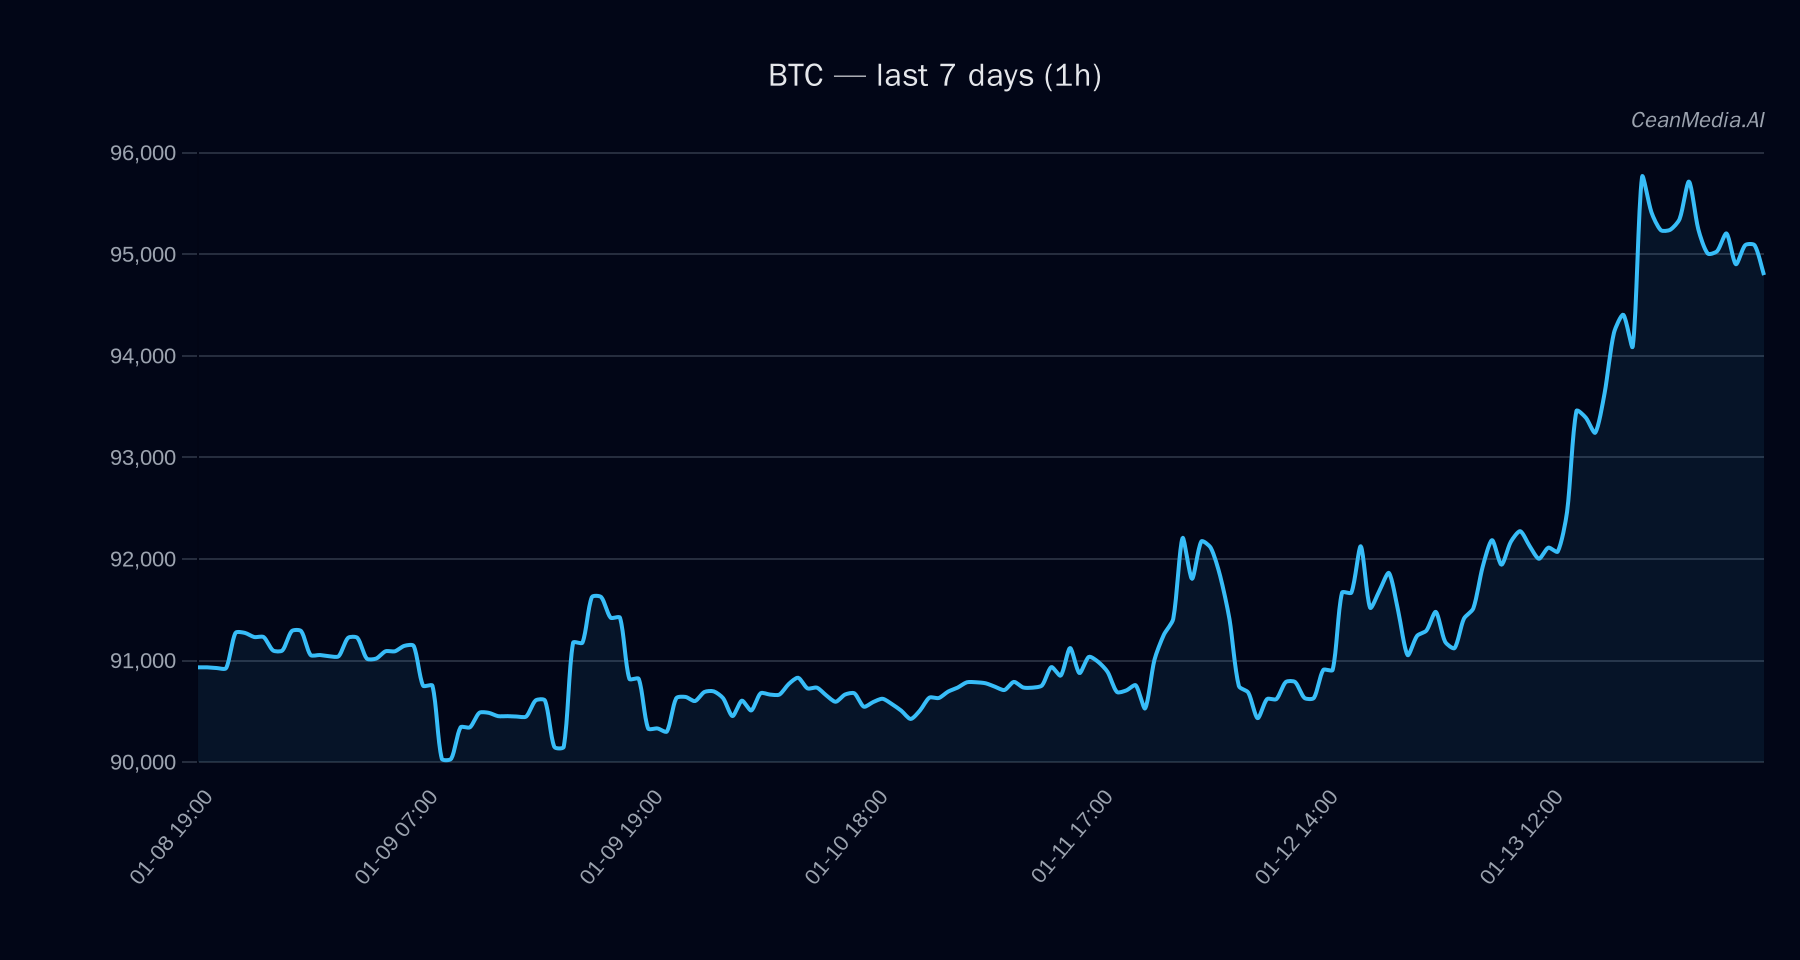
As of January 14, 2026, Bitcoin (BTC) is trading around $95,108 with a cautiously bullish outlook. The market exhibits very low volatility, and technical indicators suggest a neutral to slightly bullish bias. ETF flows for BTC and ETH indicate mixed investor sentiment, serving as additional context rather than primary trading signals.
Technical Analysis: BTC
Bitcoin is currently positioned between key support at approximately $93,200 and resistance near $97,000. A break above $97,000 could propel the price towards $98,950 to $100,890, while a decline below support at $93,200 might lead to a retest of the $89,478 level.
- Levels: Support at 93,200; Resistance at 97,000
- Bias: Bullish with a short-term probability of around 46% for upward movement
- Triggers: Break above 97,000 targets 98,950–100,890; break below 93,200 targets 91,342–89,478
- Invalidation: Sustained move below 93,200 invalidates bullish outlook
Technical signals include EMA12 above EMA26, SMA50 above SMA200, and RSI at 63, indicating a bullish momentum that remains neutral due to very low volatility regime.
Drivers
- Return 24H: Slight positive at 0.03%
- EMA Slope: Slight downward slope at -0.0002, suggesting a marginal weakening of momentum
- Basis Z-Score: Elevated at 1.55, indicating potential bullish basis spread
- ETF Flow Z-Score (60D): Strong inflow at 2.87, reflecting institutional interest
- Order Book Imbalance (EMA5): Slight positive at 0.14, indicating buying pressure
The overall technical backdrop remains bullish but with caution due to low volatility and mixed short-term signals.
ETF Flows (BTC/ETH)
Recent ETF data shows inflows into BTC ETFs (+$627.5M over 1 day and +$319.3M over 10 days), indicating renewed investor interest. Conversely, ETH ETF flows also remain positive, though at a lower magnitude (+$76.7M over 1 day). Notably, over the 5-day period, BTC ETF flows are negative (-$390.7M), which may suggest short-term profit-taking or risk-off sentiment. These flows are important contextual signals but should not be solely relied upon for trading decisions.
Overall, the ETF flows suggest a cautious risk-on environment, with institutional interest remaining robust in BTC but showing some short-term fluctuations.
What to Watch Next
- Monitor the 97,000 resistance level for a potential breakout
- Watch for a move below 93,200 as an invalidation of the bullish bias
- Keep an eye on ETF flow trends for signs of risk appetite shifts
- Observe volatility regimes and RSI for any changes in momentum
While ETF flows provide useful context, they should be considered alongside technical signals for a comprehensive view of market direction.
Hashtags: Bitcoin,CryptoAnalysis,MarketUpdate,ETFFlows,TechnicalAnalysis,CryptoNews,Investing,Blockchain,DigitalAssets,MarketTrends,FinancialMarkets,CryptoResearch